

In today’s article, Tipstrade.org will explore the concept of market psychology, an aspect that many traders often overlook when placing trades. Understanding market psychology can help traders achieve higher profits and avoid unnecessary losses.
What is market psychology?
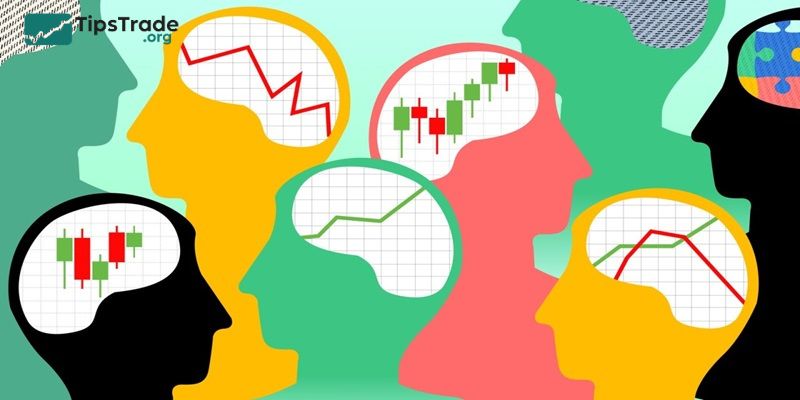
Market psychology refers to the emotions and sentiments of market participants that can influence the overall direction of the market. Factors such as mood or bias may affect trading activity in the stock market, including how and when people decide to buy or sell stocks.
For example, when traders feel optimistic or have positive expectations about certain stocks, the overall market pattern may trend upward. Conversely, when prices decline and the market enters a bearish phase, investors may become anxious or fearful, causing trading activity to slow down.
- Mastering Indicator Combination for Profitable Trading
- What is Trading Psychology & How to Control it Effectively?
- Risk Management: The Role of Technology in Risk Prevention
- How to Conduct Market Trend Analysis Effectively for Beginners
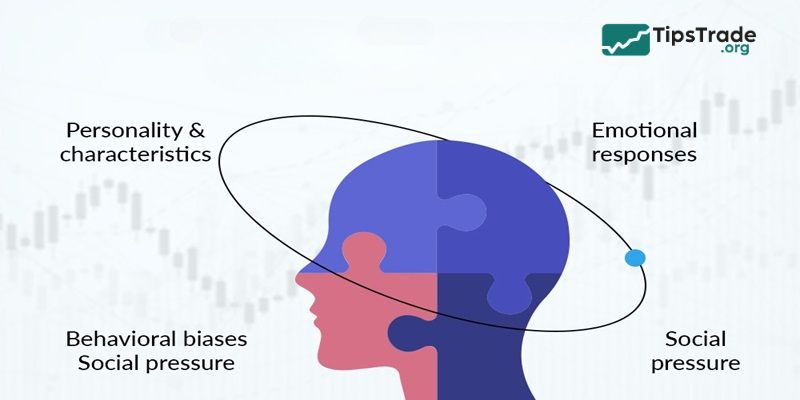
Market psychology represents the intersection between behavioral finance and investment strategy. It highlights the emotional and cognitive factors that drive investor behavior, which in turn shape market trends and influence investment decisions. Since market volatility is often driven more by collective emotions than by pure fundamentals, understanding the principles of market psychology becomes an essential skill for any astute investor or financial analyst.
Market psychology not only explains the reasons behind seemingly irrational market movements but also helps professionals develop foresight to navigate market fluctuations with greater confidence and strategic insight when building investment strategies.
Market psychology, often used interchangeably with investor psychology, reflects the overall attitude of investors toward a particular financial market or security.
Research in behavioral economics examines the limitations and emotional influences that decision-makers may face when trading stocks. It encompasses both market psychology and trading psychology. While market psychology focuses on the collective sentiments and behaviors of market participants as a whole, trading psychology examines the attitudes and decision-making processes of investors at the individual level.
Different types of market psychology
Market psychology encompasses various emotions and behaviors expressed by investors, including fear, greed, optimism, pessimism, herd mentality, and risk aversion. Psychological factors in the market often drive trends and can contribute to price movements that exceed their fundamental valuations.
The main types of market psychology include:
- Fear and Greed: These are the most basic psychological forces in the stock market and are experienced by almost all investors, especially beginners. Fear can lead to selling pressure and market downturns, while greed can trigger buying frenzies and speculative bubbles.
- Herd mentality: Investors often follow the crowd, which can lead to momentum trading and excessive market volatility driven by collective sentiment rather than underlying fundamentals.
- Confirmation bias: Investors tend to seek out information that supports their existing beliefs or biases, potentially ignoring conflicting data that could influence their investment decisions.
- Overreaction: This refers to the tendency of investors to interpret information in an overly optimistic manner. They may overestimate their knowledge and their ability to predict market movements. When overreacting, investors may incorrectly assume that a random event will continue to occur. This mindset often appears when traders analyze long-term data.
- Recency bias: This refers to the tendency to prioritize recent events over historical data. Investors may place excessive importance on recent market performance and expect it to continue, which can lead to poor decision-making.
- Risk aversion: During periods of uncertainty, market participants may become more risk-averse, preferring safe-haven assets or defensive stocks over higher-risk investments.
How to analyze market psychology
Technical analysis
Analyzing price patterns such as the head and shoulders pattern, cup and handle pattern, and candlestick patterns can reflect market psychology. In addition, several technical indicators such as moving averages (MA), RSI, and MACD can help identify market trends and investor sentiment.
Fundamental analysis, particularly the analysis of financial statements, is commonly used to identify potentially profitable investment opportunities. Market psychology generally plays a limited role when interpreting financial statement data.
Market sentiment indicators
Some sentiment indicators, such as the VIX index and the put/call ratio, can measure the level of investor sentiment toward the market.
The RSI indicator can also reflect market psychology. Its values range from 0 to 100 and indicate overbought or oversold conditions, thereby providing signals for potential upward or downward price movements.
Trading volume
One way to determine market psychology is by examining the total volume of shares traded. Trading volume reflects the emotional state of investors. A sudden surge in trading volume may create a “shock” for poor investments but may represent “excitement” for profitable ones.
News and media analysis
Regularly monitoring economic, political, and corporate events can help investors anticipate shifts in market psychology. In addition, investors can analyze data from social media platforms and financial forums.
Investors can also rely on surveys conducted by research organizations that collect opinions from investors about market outlooks. Furthermore, insights from financial experts and fund managers can provide valuable perspectives on overall market sentiment.
Using specialized tools and software
Many financial institutions offer tools and platforms designed for market analysis, featuring specialized indicators and functions to assess market psychology. Examples include MetaTrader, Bloomberg Terminal, and Commitment of Traders (COT) reports.
Analyzing market psychology helps investors make more informed decisions, avoid emotional traps and herd behavior, develop effective risk management strategies, and improve their overall investment approach in a more stable and consistent manner.
Real-world examples of market psychology
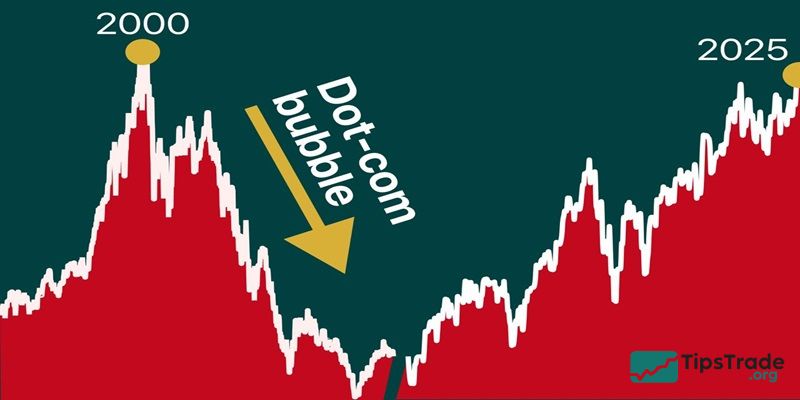
- Example 1: The Dot-Com Bubble
In the late 1990s, excessive optimism and speculative buying fueled the dot-com bubble, causing the stock prices of internet-related companies to surge dramatically. The subsequent burst of the bubble highlighted the significant impact of investor psychology on the stock market.
- Example 2: The COVID-19 Pandemic
The outbreak of the COVID-19 pandemic in 2020 triggered widespread fear and uncertainty, leading to sharp declines in global markets. Subsequent government interventions and positive news about vaccines contributed to a market recovery, emphasizing the role of human psychology in the rebound of stock markets.
- Example 3: Elon Musk and the Twitter Acquisition
Elon Musk purchased Twitter for $44 billion in October 2022. Shortly afterward, he laid off about 3,700 employees, roughly half of Twitter’s workforce. This move attracted significant criticism from the media, business community, and investors. As a result, the stock price of Tesla dropped significantly by around 54%.
Although Tesla’s business model remained fundamentally strong, investors reacted strongly to Musk’s actions. However, by November 2022, the stock price began to stabilize. This example illustrates how market psychology can significantly influence stock prices and how investor sentiment can change over time.
Useful market psychology indicators
Margin debt
This indicator shows the amount of money borrowed to purchase new stocks. As margin debt increases, the risk to the stock market also rises, as it indicates that portfolio value fluctuations could significantly amplify or reduce investor returns.
VIX volatility index
The VIX index generates forecasts of market volatility and can indicate the speed and range of price changes over a given period. Investors use the VIX to assess market sentiment, specifically the level of fear among market participants.
High-low index
This ratio compares the number of stocks reaching their 52-week highs with those reaching their 52-week lows. Investors can use this ratio to determine whether the market is experiencing a bullish or bearish phase.
Put/call ratio
This ratio analyzes the volume of put options (the right to sell an asset) versus call options (the right to buy an asset) over a period. Investors use the put/call ratio to gauge overall market sentiment, as it can indicate whether the market leans bearish or bullish.
Bull and bear strength
This indicator measures the strength of market trends and helps assess the positions of buyers and sellers. Investors can use it as a signal to identify optimal times to buy or sell an asset.
Commitment of Traders (CoT) report
Many commodity traders use this report to forecast future prices. They often take positions contrary to what the majority of market participants are doing.
Conclusion
Market psychology is a crucial factor in financial trading, significantly influencing price trends and traders’ decisions. Effectively understanding and using sentiment-measuring tools can help traders enhance their analytical skills and decision-making. However, these tools are not perfect and should be used alongside other analytical methods to achieve optimal results. A balanced approach that combines market psychology with strict risk management is the key to successful trading in any market.
See more: