
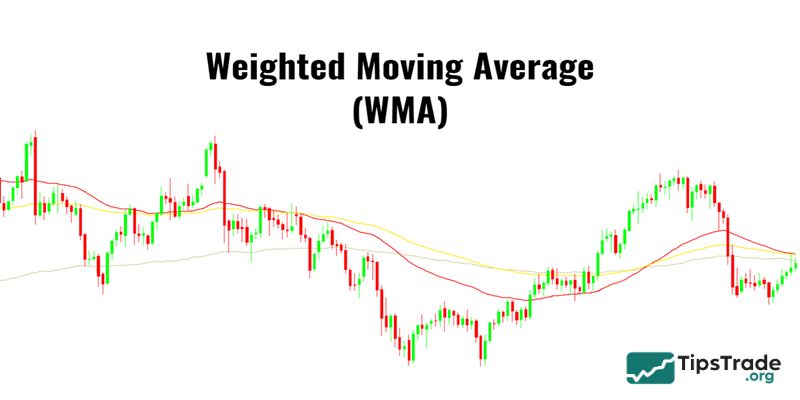
WMA (Weighted Moving Average) is a type of moving average that takes recent price levels into account and applies weighting in its calculation. For many traders, this feature is both useful and more effective in practice. If you are unfamiliar with or not confident about this technical indicator, today’s article will help you better understand […]
Category Archives: Technical analysis
12
Mar
Mar
In the highly volatile world of financial trading, the EMA (Exponential Moving Average) is one of the most sensitive and effective technical analysis tools for investors to capture market trends. Unlike other indicators, this tool offers a more flexible perspective by emphasizing the most recent data, helping traders make accurate and timely trading decisions. So, […]
12
Mar
Mar
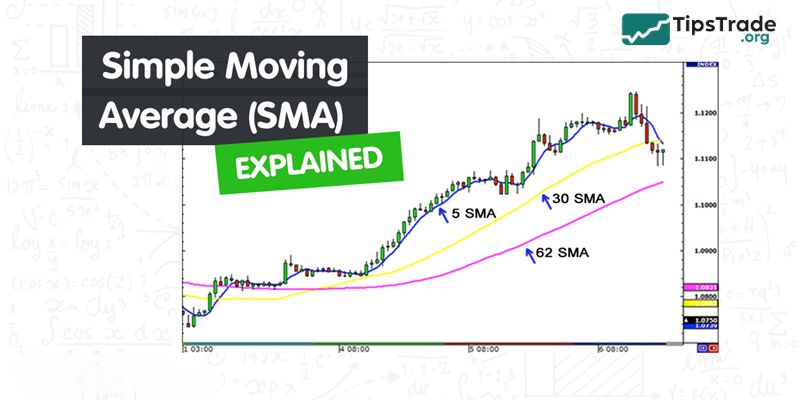
SMA is one of the most popular moving averages trusted by many traders, including beginners, especially those who follow technical analysis. Although it is not a particularly complex tool, many people do not fully understand this technical indicator. In today’s article, let’s explore what is the SMA indicator, how it works, and the trading strategies […]
12
Mar
Mar
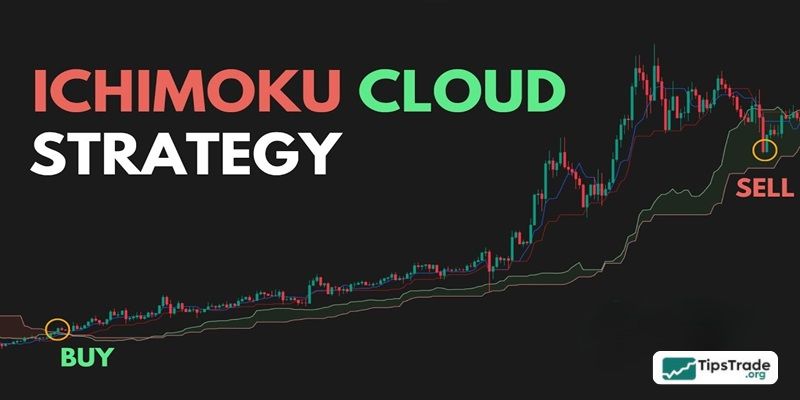
The Ichimoku Cloud is a powerful trading tool in the financial markets. This indicator can function as an almost complete, standalone trading system. However, many beginner traders still feel confused when interpreting its signals, which can lead to misunderstandings of Ichimoku signals. In the article below, Tipstrade.org explains what the Ichimoku cloud is. Beside that, […]

11
Mar
Mar
In today’s article, Tipstrade.org will explore the concept of market psychology, an aspect that many traders often overlook when placing trades. Understanding market psychology can help traders achieve higher profits and avoid unnecessary losses. What is market psychology? Market psychology refers to the emotions and sentiments of market participants that can influence the overall direction […]
11
Mar
Mar
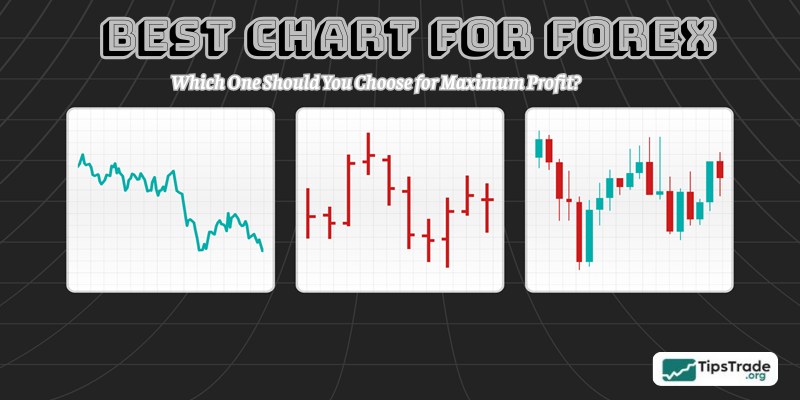
In the world of Forex trading, charts are more than just lifeless red and green lines. They are the “maps” that guide you, the language of the market, and the most critical tool for a trader to analyze crowd psychology. However, with dozens of different chart types available on platforms like MT4, MT5, or TradingView, […]
09
Mar
Mar
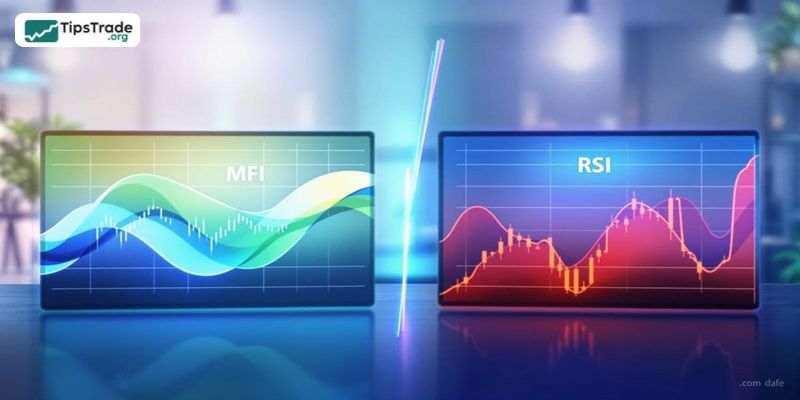
MFI vs RSI: Which is better? is a topic that attracts significant attention from traders who are looking for effective technical indicators to analyze financial markets. Both indicators belong to the momentum category and are widely used in Forex, stock, and cryptocurrency trading. However, each indicator has its own calculation method and provides trading signals […]
09
Mar
Mar
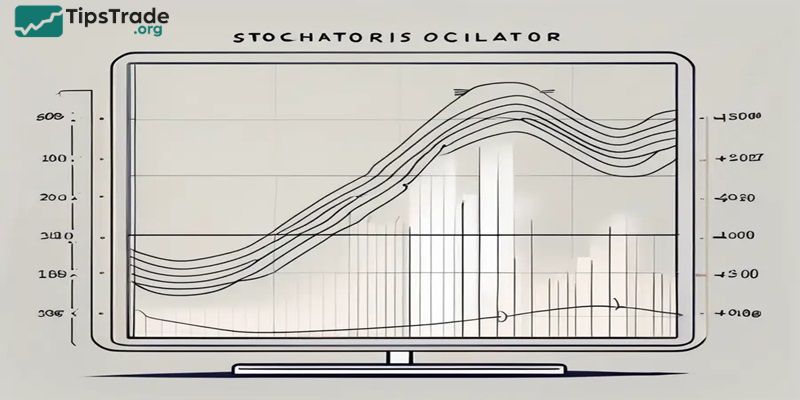
The Stochastic Oscillator is a momentum indicator that is widely used and highly effective in trading, alongside other indicators such as RSI, MACD, and more. However, many new traders use the Stochastic indicator mechanically, which can lead to misleading signals and low trading effectiveness. This article will help you understand what the Stochastic Oscillator indicator […]
06
Mar
Mar
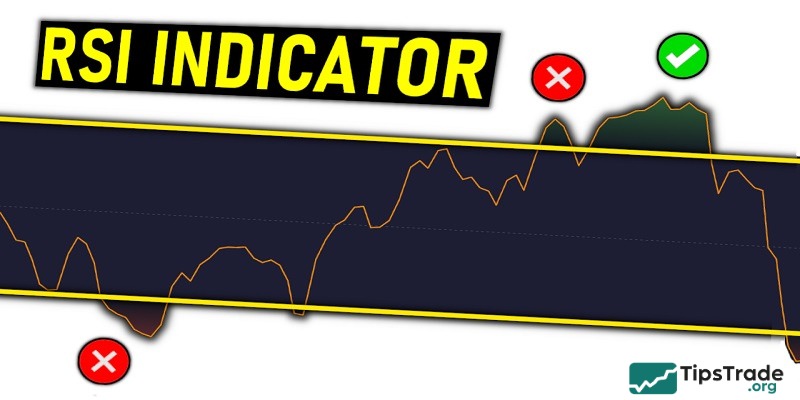
To succeed in Forex trading, accurately determining the right time to buy and sell is extremely important. Traders often use supporting tools to make effective trading decisions, and the RSI Forex technical indicator is one of them. So, what is the RSI Forex indicator? Let’s explore it together with Tipstrade.org! What is RSI Forex? The […]
06
Mar
Mar
Stoch RSI is known as an extremely useful indicator for traders in financial markets. It is a technical indicator that helps traders identify market trends. So, what exactly is the Stoch RSI indicator? Let’s dive into the details on this topic with Tipstrade.org in today’s article. Let’s get started!!! What is Stoch RSI? Stoch RSI, […]