
SMA is one of the most popular moving averages trusted by many traders, including beginners, especially those who follow technical analysis. Although it is not a particularly complex tool, many people do not fully understand this technical indicator. In today’s article, let’s explore what is the SMA indicator, how it works, and the trading strategies that can be applied using this indicator.
What is the SMA indicator?
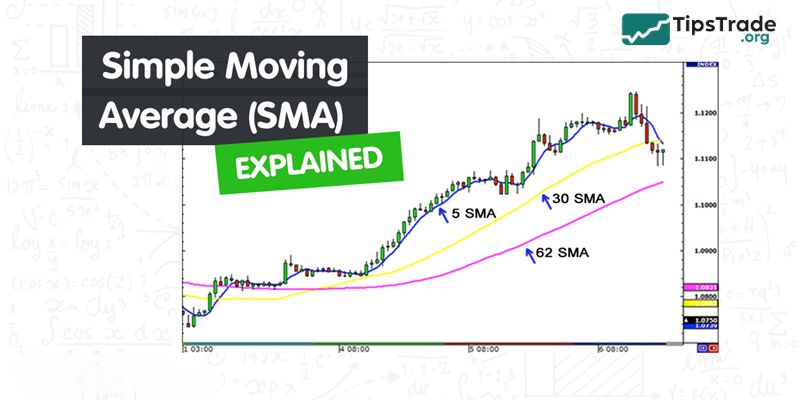
The SMA (Simple Moving Average) is a technical indicator that helps traders observe price fluctuations in the market and identify trends over a specific period of time. As its name suggests, the Simple Moving Average is the simplest type of moving average among all MA indicators. For this reason, it is widely favored by many traders, especially those who are new to the market.
However, the Simple Moving Average still retains the typical characteristic of moving averages, which is lag. In simple terms, when the market price has already formed a peak or a bottom, the corresponding peak or bottom on the Simple Moving Average will only appear afterward. This is an important feature that traders should keep in mind when using this indicator. The shorter the SMA period (i.e., the more short-term it is), the more delayed the signals it produces, and you will notice that it tends to follow the price movement less closely.
See more:
- The ADX Indicator: What Is It And How To Use It?
- Understanding RSI indicator: A Beginner’s Guide
- What is the MACD Indicator and How to Use It?
- A Complete Guide to Using the Stochastic Indicator from A–Z
Common types of SMA
The most commonly used Simple Moving Averages indicator in the market today include:
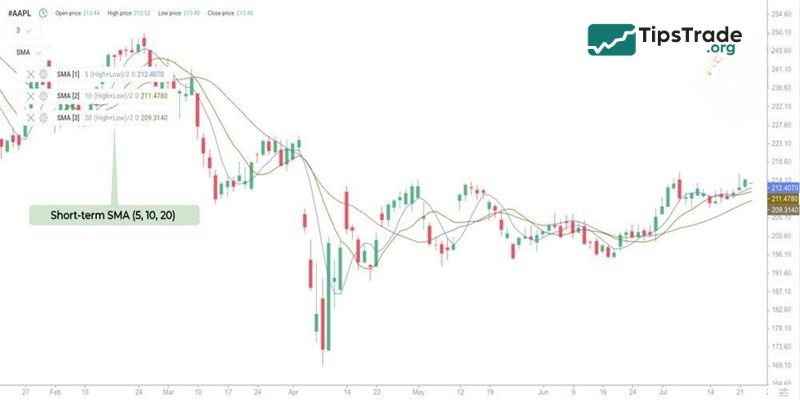
- Short-term SMAs: SMA 10, SMA 20
- Medium-term SMA: SMA 50
- Long-term SMAs: SMA 100 and SMA 200
However, these are only the most commonly used Simple Moving Average in the market. The choice of the period for a Simple Moving Average ultimately depends on each trader’s trading strategy. The longer the period, the more it reflects the long-term trend of the Simple Moving Average, and vice versa.
How SMA is calculated
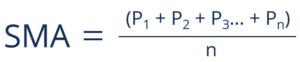
The equation for Simple Moving Average is quite simple. It is just the average closing price of a security over the last “n” periods.
Let us give a quick and easy example. Suppose Company A posted the following closing stock prices:
| Day (n) | Prices (P) |
| 1 | $10 |
| 2 | $12 |
| 3 | $9 |
| 4 | $10 |
| 5 | $15 |
| 6 | $13 |
| 7 | $18 |
| 8 | $18 |
| 9 | $20 |
| 10 | $24 |
Using a 5-day Simple Moving Average, we can calculate that at Day 10 (n=10), the 5-day Simple Moving Average is $18.60.
Simple Moving Average = (13 + 18 + 18 + 20 + 24) / 5 = 18.60
Using a 10-day Simple Moving Average, we can calculate that at Day 10 (n=10), the 10-day Simple Moving Average is $14.90.
Simple Moving Average = (10 + 12 + 9 + 10 + 15 + 13 + 18 + 18 + 20 + 24) / 10 = 14.90
Compared with Day 10’s closing price of $24, the 5-day SMA of $18.60 was a lot closer than the 10-day SMA of $14.90. It is once again because the 5-day SMA is a shorter period, which follows the price more closely, whereas the 10-day SMA considers more historical data.
Meaning of the Simple Moving Average in trading
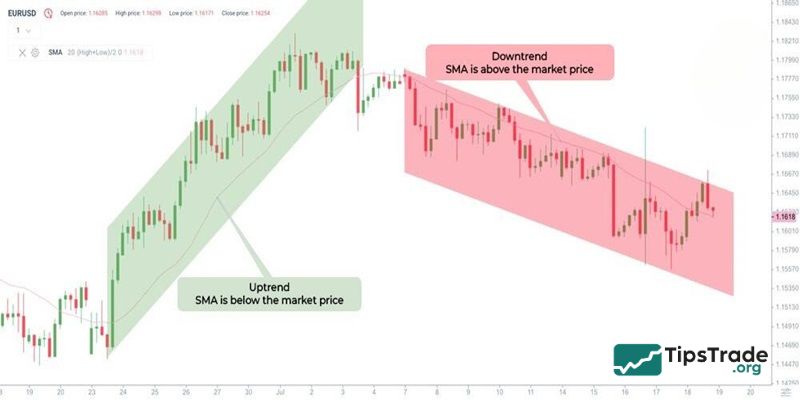
As mentioned at the beginning of this article, the Simple Moving Average is an important indicator in technical analysis used to identify the current trend and predict potential future trends. At the same time, this technical indicator also acts as a dynamic support and resistance line on the chart.
When the price line is above the Simple Moving Average, the indicator acts as a support level. And conversely, the Simple Moving Average functions as a resistance level. Since the Simple Moving Average is not a straight line but fluctuates along with price movements, it is considered a dynamic support and resistance level. Depending on the period of the Simple Moving Average, traders can evaluate whether the support or resistance level is strong or weak.
Trading strategies using the Simple Moving Average
The Simple Moving Average is commonly used in trading through several popular strategies, such as:
- Price crossover strategy: Traders monitor the moment when the Simple Moving Average crosses the price line of a stock. When the price moves above the Simple Moving Average, it tends to rise in the following period. Therefore, traders often look for buying opportunities. Conversely, when the price crosses below the Simple Moving Average, traders may expect the price to decline and potentially enter a downward trend in the near future. At this point, traders will look for selling opportunities.
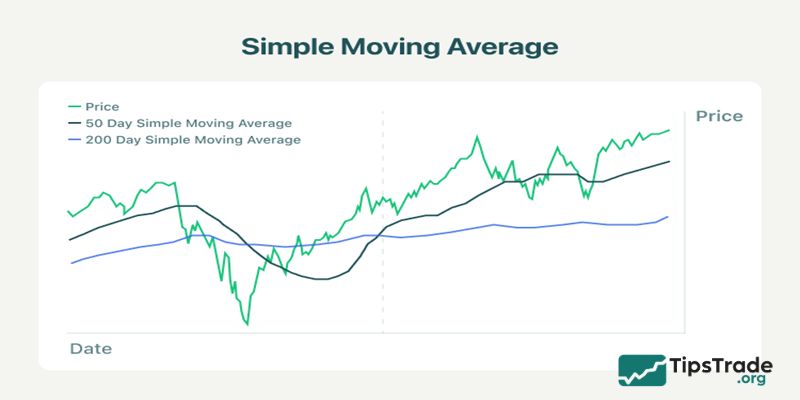
- Moving average crossover strategy: Instead of using only one Simple Moving Average, traders can use two Simple Moving Average with different periods. They observe the points where these two Simple Moving Average intersect to identify potential entry opportunities. Typically, long-term investors use the SMA 50 and SMA 200 combination, while short-term traders may prefer SMA 10 and SMA 20.
In addition to these two strategies, traders can also combine the Simple Moving Average with other technical indicators or analytical tools to make their predictions and analyses more reliable. At the same time, it is important to pay attention to the lagging nature of this indicator so that it can be used appropriately according to each trader’s strategy.
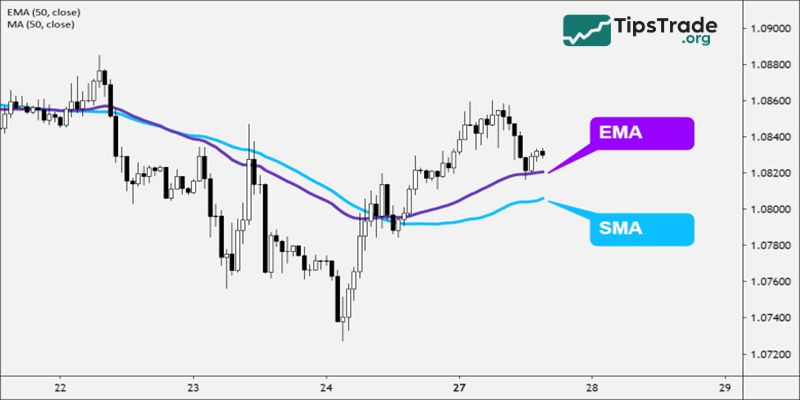
Difference between SMA and EMA: Which one should be used in trading?
The EMA (Exponential Moving Average) is an exponential moving average calculated using an exponential formula. Because EMA assigns greater weight to more recent price data, it is more sensitive to short-term price fluctuations, which allows it to generate trading signals earlier than the Simple Moving Average.
This leads to the question: Should traders use SMA or EMA in trading? The answer is that it depends on the market in which you are investing and trading. For example:
- If you invest in large-cap stocks with relatively stable information and low volatility, the Simple Moving Average may be more suitable for you (such as SMA 100 or SMA 200).
- If you trade highly volatile stocks in the market, the EMA may be more appropriate. Because EMA responds more quickly to price fluctuations, it can provide more timely trading signals than the Simple Moving Average.
Conclusion
The SMA (Simple Moving Average) is a simple technical indicator, yet it is no less effective than many other indicators. This article has explained what the Simple Moving Average is, helping you better understand how to apply it in trading and investing. Be sure to regularly update your knowledge with Tipstrade.org!
See more: