
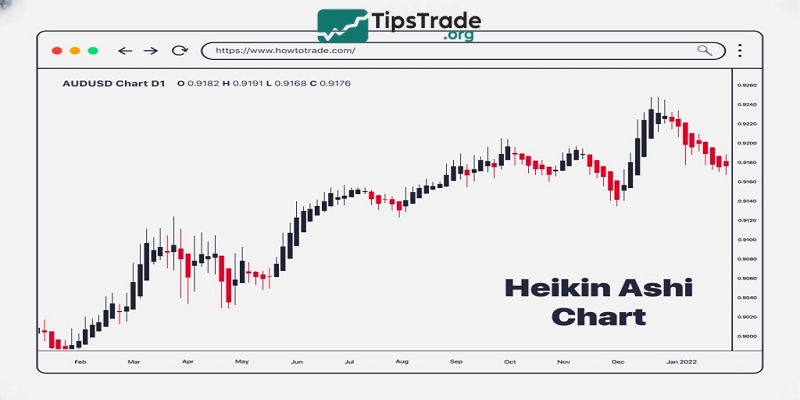
The Heikin-Ashi chart, along with Japanese candles, are two types of price candles developed by the Japanese. The Heikin-Ashi chart is an indicator, not another type of price chart. This candle has the potential to absolutely identify trends for investors to use. So, what is the Heikin-Ashi chart? What are the advantages and disadvantages of this type of candle? How do you use it? Let’s follow the article below!
What is the Heikin-Ashi chart?
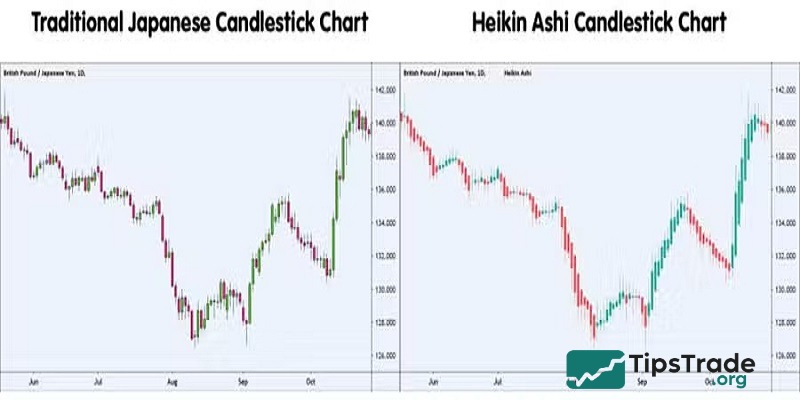
In Japanese, Heiken means “average,” and Ashi means “bar” or “foot.” Therefore, Heiken-Ashi translates to “average bar.” The value of the Heikin-Ashi chart is calculated based on both past and current data. Although Heiken Ashi shares many similarities with traditional Japanese candlestick charts, it is actually an indicator rather than a price chart. The main difference between a traditional candlestick chart and a Heiken-Ashi chart lies in the latter’s use of a modified formula based on two moving averages instead of open, high, low, and close prices. As a result, this technique produces a smoother chart, making it easier to identify trends and potential reversals with greater accuracy.
>>See more:
- Basic price charts in trading and how to read each type
- Forex Pattern Trading: A Key to Predicting Currency Movements
- Best Popular Types of Reversal Patterns In Trading
- Top 5 Most Common Continuation Patterns to Capture Market Trends
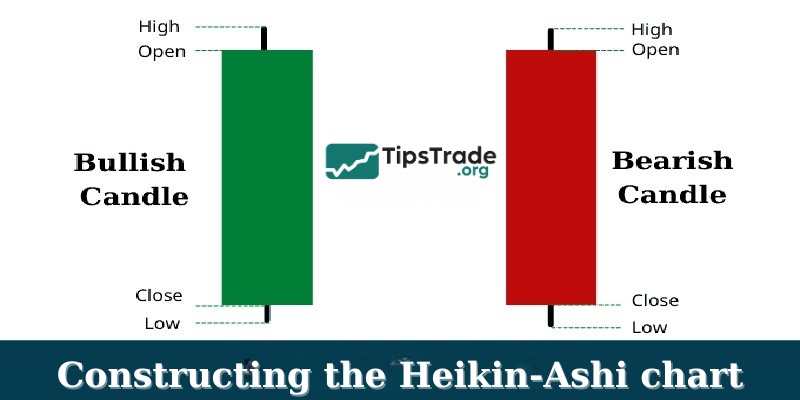
Constructing the Heikin-Ashi chart
Heiken Ashi is created using data from the previous and current candlesticks. This type of candlestick also includes four components: open, close, high, and low prices, specifically as follows:
- The color of Heiken-Ashi candles is typically red during a downtrend and green during an uptrend.
- Heikin Ashi Close: (Open + High + Low + Close) / 4. This is the average price of the current bar.
- Heikin Ashi Open: (Previous Heikin Ashi Open + Previous Heikin Ashi Close) / 2. This is the midpoint of the previous Heikin Ashi bar.
- Heikin Ashi High: The maximum value among the current bar’s High, the Heikin Ashi Open, and the Heikin Ashi Close.
- Heikin Ashi Low: The minimum value among the current bar’s Low, the Heikin Ashi Open, and the Heikin Ashi Close.
Characteristics of Heikin-Ashi chart
Heiken Ashi also possesses its own unique characteristics, and once investors understand these traits, they can apply them successfully in trading.
Heiken Ashi candles are calculated based on both past and current data. As a result, candlestick patterns directly influence one another, causing a certain degree of lag. This is the most distinctive feature of the Heiken Ashi candlestick model.
- They provide safer and more accurate entry and exit signals thanks to their ability to smooth out information, allowing investors to trade with greater confidence, especially in volatile stock markets.
- They clearly indicate the market trend.
- The charts are visually simple, not overloaded with information, and easy to read, making them suitable for beginner investors.
Advantages and disadvantages of Heikin-Ashi chart
Like other candlestick patterns, Heiken Ashi also has its own advantages and disadvantages. Specifically:
Advantages of Heikin-Ashi chart
- Just by looking at the shape and color of the candlesticks, you can get information about the price action during the session. Investors can know which side is holding the market and how volatile the trading session is.
- Reducing false signals helps to identify trends more clearly.
- It is easier for users to follow the market thanks to the price lubrication effect.
- Candle shadows are less than regular Japanese candlestick charts, so investors can easily determine market price momentum.
- Ability to combine with other indicators: The Heikin-Ashi indicator can be combined with other technical indicators to give even stronger signals about market movements.
Disadvantages of Heikin-Ashi chart
- There is a high latency so investors will not be able to react if the market reverses.
- The current market price is not known and should not be used to place orders.
- Heiken Ashi candlestick forecast signals are not effective in taking profits.
- Lower popularity
Heikin-Ashi charts vs. Japanese candlestick charts
Similarities:
- Heiken Ashi candles resemble regular Japanese candles in appearance, consisting of a candle body and upper and lower wicks (if any).
- Heikin-Ashi chart also include the four price points: high, low, open, and close, just like Japanese candles.
Differences:
|
Feature |
Heiken Ashi |
Japanese Candles |
|
Displayed Price |
Current price combined with a calculation based on the previous candle |
Current market price |
|
Candle Color in a Trend |
Solid green or red during an uptrend or downtrend |
Alternating green and red within a trend |
|
Signals |
Reversal signals are delayed |
Reversal signals occur as soon as the candle identifies the turning point |
How to use Heikin-Ashi chart in trading
Although identifying this candle type from the rather complex formula of the previous price candle is quite intricate, the effectiveness and application of the Heikin-Ashi chart make it worthwhile for investors to study and implement.
Heiken Ashi identifies market trends
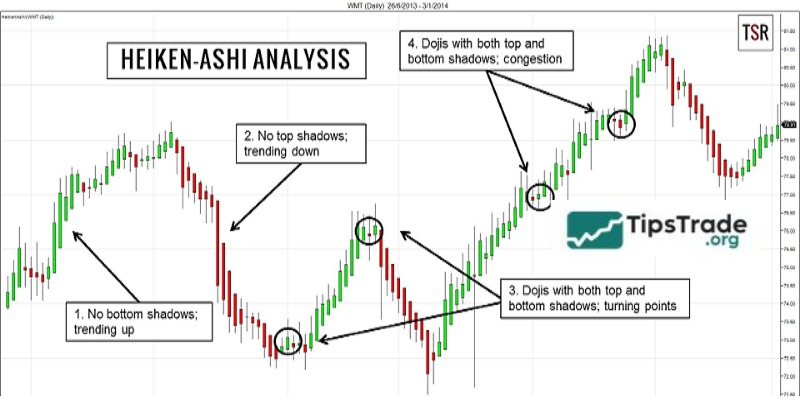
Market trends can be visually recognized through the structure of price movements. In an uptrend, prices form higher highs and higher lows, whereas in a downtrend, prices form lower highs and lower lows.
With a Heikin-Ashi chart, identifying trends becomes easier thanks to the unique characteristics of the candles that form the trend, something that traditional Japanese candlestick charts cannot achieve as clearly.
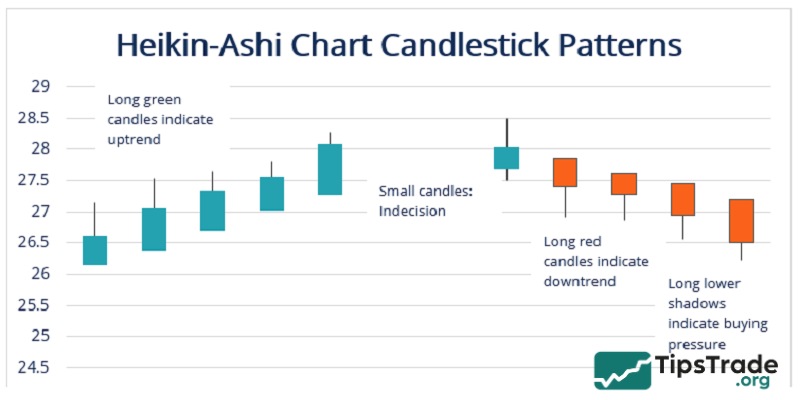
In an uptrend, green (bullish) candles appear overwhelmingly and consistently, while red candles are rare and may not appear at all during a strong uptrend. The green candles forming the uptrend usually have long upper wicks and very short or nonexistent lower wicks.
Heiken Ashi provides trend forecast signals
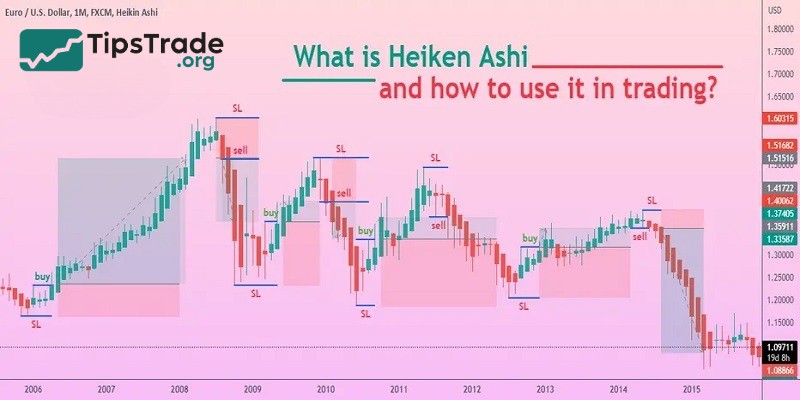
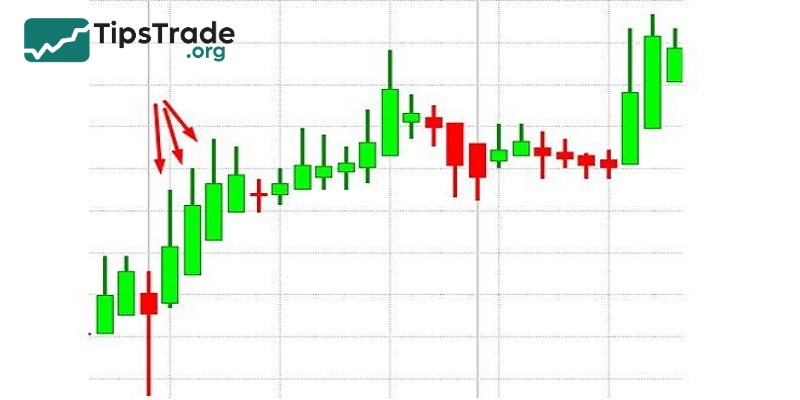
- Buy signal
When a series of at least three consecutive green (bullish) Heiken Ashi candles appear, with long bodies, long upper wicks, and short or no lower wicks, it indicates that the market is in an uptrend and is likely to continue rising. This presents an opportunity to enter a Buy position.

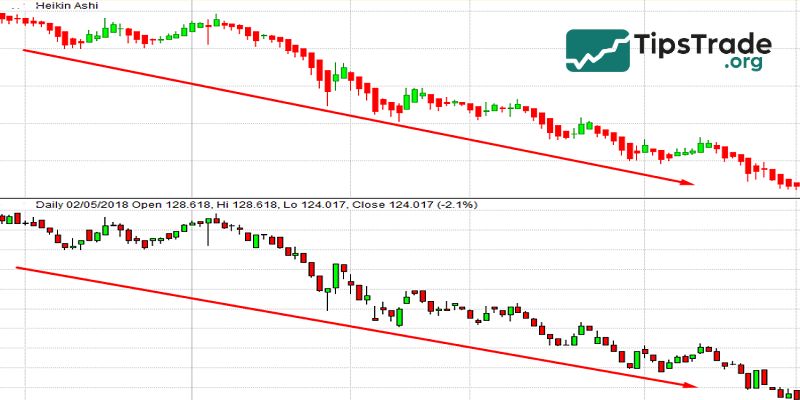
- Sell signal
When a series of at least three consecutive red (bearish) Heiken Ashi candles appear, with long bodies, long lower wicks, and short or no upper wicks, it indicates that the market is in a downtrend and is likely to continue falling. This presents an opportunity to enter a Sell position.
Heiken Ashi provides potential reversal signals
The Heikin-Ashi chart that gives this signal is the Doji candle. The characteristics of a Heiken Ashi Doji are similar to a regular Japanese Doji: it has a short body (almost a straight line) with upper and lower wicks.
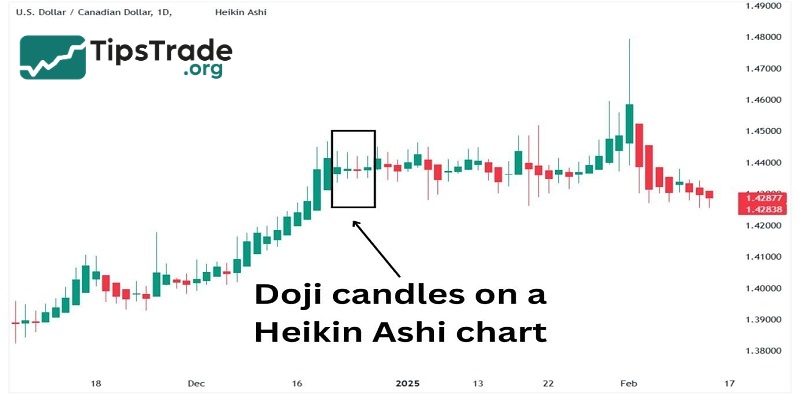
When a Heiken Ashi Doji appears within a trend, it indicates market hesitation. Two possibilities may occur: either the market is taking a brief pause before the dominant side pushes the current trend forward with stronger momentum → trend continuation; or the strength of the dominant side is weakening, giving the opposing side a chance to enter the market → trend reversal.
Heiken Ashi identifies certain price patterns better
Thanks to characteristics such as candles appearing denser and closer together, having few lower wicks in an uptrend or few upper wicks in a downtrend, and the overall smoothing effect, Heiken Ashi charts make it easier to identify price patterns.
This is especially true for patterns defined by trend lines. Among them, the Triangle and Wedge patterns are the two most frequently appearing price patterns on the Heikin-Ashi chart.
Which indicators work best with Heikin-Ashi charts?
For Heiken Ashi charts, choosing the right indicator often depends on a trader’s experience and personal preference. Moving Averages (MA), Bollinger Bands, and the Relative Strength Index (RSI) are indicators that can be used effectively with Heiken Ashi. The key is to combine Heiken Ashi with the indicators you are most familiar with, as this will help optimize your trading performance.
Is the Heikin-Ashi chart reliable?
Heikin-Ashi can be considered a reliable charting tool for financial trading. This method uses averages to create special price bars, which help smooth out short-term fluctuations and highlight long-term trends. However, it is important to note that this may cause some discrepancies with the actual market prices.
The key is to use Heikin-Ashi as a supplementary tool and integrate it into overall technical analysis. This approach enhances the ability to generate more accurate trend signals. In short, it is best to combine Heikin-Ashi with technical analysis to determine optimal entry and exit points in the market.
Conclusion
The Heikin-Ashi chart is a pattern that provides fairly accurate trading signals and identifies the main trend. However, the lag of this candlestick pattern is a “fatal” weakness that makes investors hesitant to use it. Investors should combine multiple indicators to optimize their investment decisions. Wishing all traders successful trading!