
In the volatile world of financial investment, finding effective technical analysis tools is extremely important. And the CCI indicator is one of the top indicators widely used by many traders. In this article, Tipstrade.org will delve into what the CCI indicator is, how it is calculated, and most importantly, how to apply this indicator to make informed trading decisions.
What is the CCI indicator?
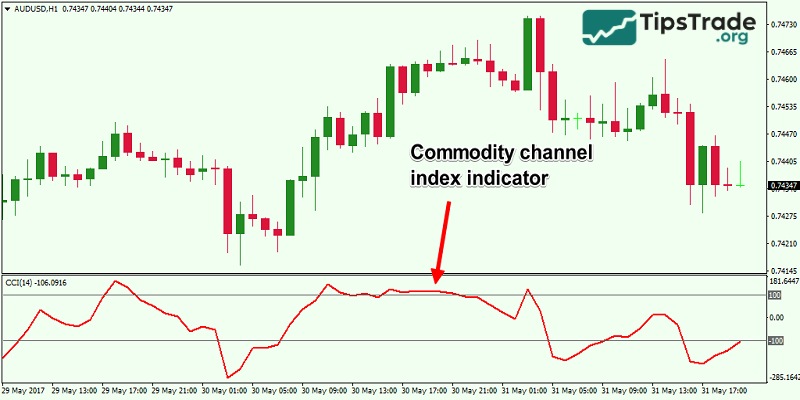
The CCI indicator, also known as the Commodity Channel Index, is a technical indicator developed by Donald Lambert in 1980. Although initially designed for analyzing commodity markets, the CCI is now widely used in many other financial markets, including stocks, foreign exchange, and cryptocurrencies.
- Moving Averages and how does it use to find the trend
- Understanding RSI indicator: A Beginner’s Guide
- What is the MACD Indicator and How to Use It?
- The ADX Indicator: What Is It And How To Use It?
Key features of the CCI indicator:
- Measuring price volatility: The CCI measures the difference between the current price and the average price over a given period.
- Identifying overbought and oversold zones: The CCI helps identify when the market is overbought (likely to decline) or oversold (likely to increase).
- Detecting divergence: The CCI can be used to detect divergence between price and the indicator, which can signal a trend reversal.
Formula for calculating the CCI indicator
The CCI indicator is calculated using the following formula:

Where:
- Typical Price = (High + Low + Close) / 3
- SMA = Simple Moving Average of the Typical Price
- Mean Deviation = Average of the absolute deviations from the SMA
How to use the CCI indicator in trading
Identify overbought and oversold zones
The CCI indicator uses +100 and -100 as boundaries to identify overbought and oversold zones. When the CCI crosses above +100, this indicates that the asset price is significantly above its statistical average, signaling the possibility that the market is overbought and could reverse downward.
Conversely, when the CCI falls below -100, it indicates that the price is significantly below its average, signaling a possible oversold market and a possible reversal to the upside. However, traders should note that the CCI can remain in these zones for extended periods, especially during strong trends, and should be combined with other indicators to confirm the signal.
Looking for divergence signals
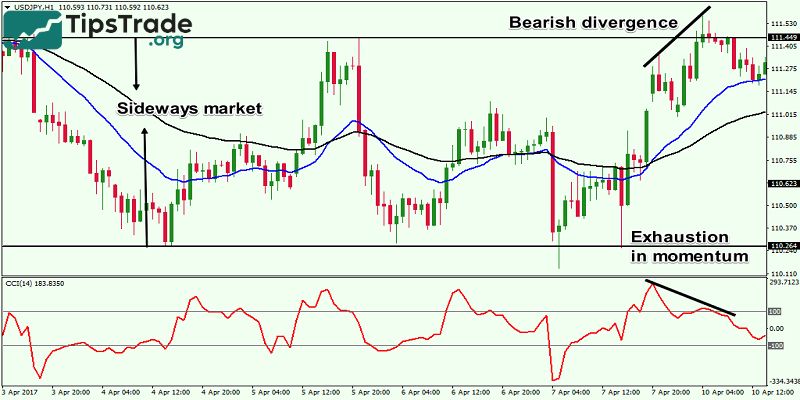
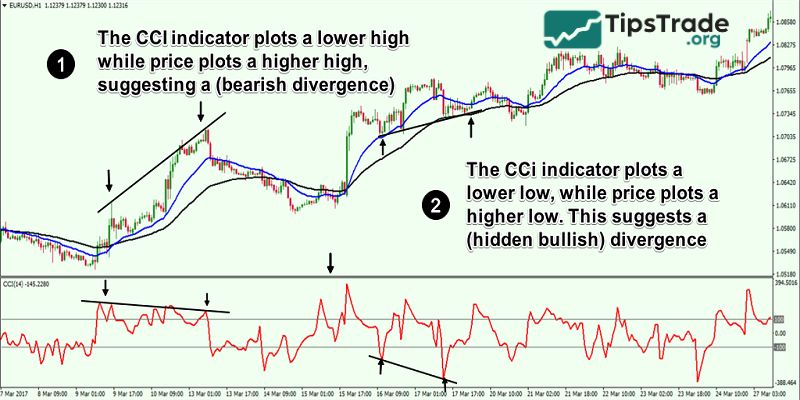
Divergence between price and CCI is a useful tool for predicting trend reversals. A bullish divergence occurs when price makes a lower low, but CCI makes a higher low, signaling a weakening downtrend and a possible reversal to the upside. A bearish divergence occurs when price makes a higher high, but CCI makes a lower high, signaling a weakening uptrend and a possible reversal to the downside. Divergence signals can provide early and highly reliable trading opportunities, especially when combined with other confirming indicators.
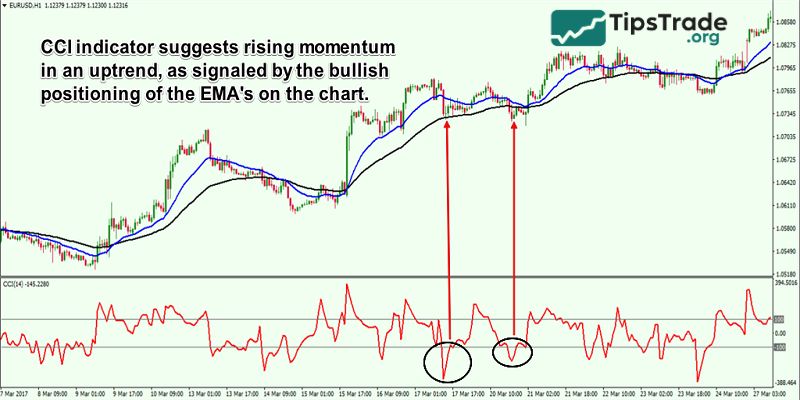
Identify market trends
The CCI indicator can also be used to determine market trends. When the CCI indicator moves and remains above the 0 line, this indicates that the uptrend is dominant. Conversely, when the CCI moves and remains below the 0 line, this indicates that the downtrend is dominant.
Additionally, the strength of a trend can be assessed by observing how much the CCI moves away from the zero line. A strong CCI move in the direction of the trend indicates that the trend is very strong, while a weak or sideways CCI move may signal that the trend is weakening or about to reverse.
Combining the CCI indicator with other indicators
To increase the accuracy of trading signals, traders often combine CCI with other technical indicators such as RSI, moving averages, or MACD. For example, if CCI and RSI both give an overbought signal, this can increase the reliability of the sell signal. Combining indicators helps to reduce false signals and increase the reliability of trading decisions, thereby improving trading efficiency.
Limitations of the CCI indicator
- Noise signals: One of the biggest limitations of the CCI indicator is its tendency to generate many noise signals, especially in sideways or highly volatile markets. This means that the CCI can generate misleading buy or sell signals, leading traders to make inaccurate trading decisions and incur losses.
- Lag: Like many other oscillators, the CCI can lag behind price changes. This means the CCI may not reflect sudden price fluctuations in a timely manner, leading traders to miss trading opportunities or enter orders too late.
- Difficult to determine precise overbought and oversold levels: Although levels of +100 and -100 are often used as boundaries for overbought and oversold zones, the CCI has no value limits. This means the CCI can break through these levels and remain in overbought or oversold zones for an extended period, especially during strong trends.
- Requirements for combination with other indicators: Due to the limitations mentioned above, the CCI should be used in conjunction with other technical indicators to increase the accuracy of trading signals. Relying solely on the CCI can lead to incorrect trading decisions and losses.
Conclusion
In summary, the CCI indicator is a powerful technical analysis tool that provides traders with important signals about market momentum and strength. By identifying overbought and oversold areas, detecting divergence signals, and confirming trends, the CCI can help traders make more informed trading decisions. However, as with any indicator, the CCI also has certain limitations and should be used in conjunction with other analysis tools to increase reliability.
See more: