

In the highly volatile world of financial trading, the EMA (Exponential Moving Average) is one of the most sensitive and effective technical analysis tools for investors to capture market trends. Unlike other indicators, this tool offers a more flexible perspective by emphasizing the most recent data, helping traders make accurate and timely trading decisions. So, what exactly is the Exponential Moving Average, and how can it be applied in the process of buying and selling financial assets? Let’s explore this in detail with Tipstrade.org through the content below.
What is EMA in trading?
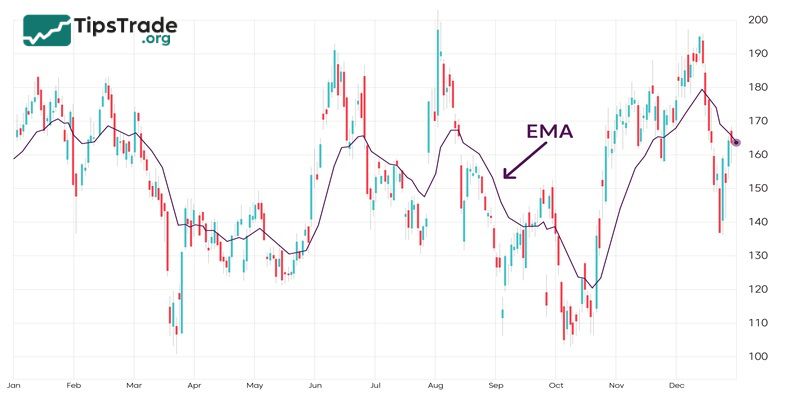
EMA (Exponential Moving Average) is a technical indicator commonly used to analyze price trends in financial markets. Unlike SMA, the Exponential Moving Average uses a weighted calculation formula that gives greater importance to more recent price data, allowing it to reflect price movements in a faster and more responsive way.
The Exponential Moving Average is built on the mathematical principle of exponential weighting, meaning that the most recent data points receive higher weight compared to older data. As a result, the Exponential Moving Average can detect trend reversals and new trends more quickly than SMA, enabling traders to react more flexibly to market movements, especially during periods of high volatility.
See more:
- What Is The SMA Indicator (Simple Moving Average)
- Moving Averages and how does it use to find the trend
- What is Weighted Moving Average (WMA) And how to use it?
- How to use Accumulation/Distribution Line for getting trading signals
Common types of the Exponential Moving Average
Depending on whether a trader focuses on short-term, medium-term, or long-term strategies, different Exponential Moving Average periods are used to track price movements. Below are the most commonly used Exponential Moving Average types on technical charts:
EMA20 – Short-Term Moving Average (20 periods)
EMA20 is often applied by swing traders or day traders. When the price rises above the EMA20, it indicates that a short-term uptrend is forming. Conversely, if the price falls below the EMA20, it may signal a reversal into a downtrend.
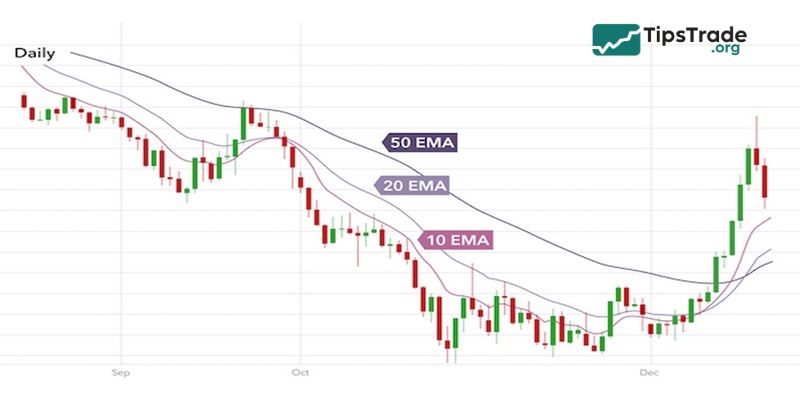
EMA50 and EMA100 – Medium-Term Moving Averages (50 and 100 periods)
These indicators are suitable for investors holding positions for several weeks to a few months. When the price stays above the EMA50 or EMA100, it reflects a stable medium-term uptrend. If the price slips below these lines, it may serve as a warning of a correction or a weakening trend.
EMA200 – Long-Term Moving Average (200 periods)
The EMA200 is considered a foundational trend line for long-term investing. When the price remains above the EMA200, the market is generally seen as being in a strong growth phase. Conversely, if the price breaks below the EMA200, it signals that the market may be entering a long-term decline or trend reversal.
EMA formula and how to calculate it
The formula for the Exponential Moving Average is given by:
EMAtoday = (Pricetoday ×α) + (EMAyesterday ×(1−α))
Where:
- Pricetoday is the most recent price.
- EMAyesterday is the EMA value from the previous period.
- 𝛼 is the smoothing factor, calculated as 2 / (𝑁+1), where 𝑁 is the number of periods.
The formula for calculating Exponential Moving Average involves several steps. First, calculate the simple moving average (SMA) for the initial Exponential Moving Average value. Then, calculate the weighting multiplier, which assigns greater importance to recent prices. The formula looks something like this:
- Calculate the SMA for the initial Exponential Moving Average value (usually over a specific number of days).
- Determine the weighting multiplier, calculated as [2 / (selected period + 1)]. A 10-day EMA would be [2 / (10+1)] = 0.1818.
- Calculate the Exponential Moving Average for each day using the formula: Exponential Moving Average = (closing price – EMA (yesterday)) x multiplier + EMA (yesterday).
How to use the EMA in trading
Exponential Moving Average is a flexible tool. There are many ways to use it. Here’s what you must know to learn how to use the Exponential Moving Average in trading.
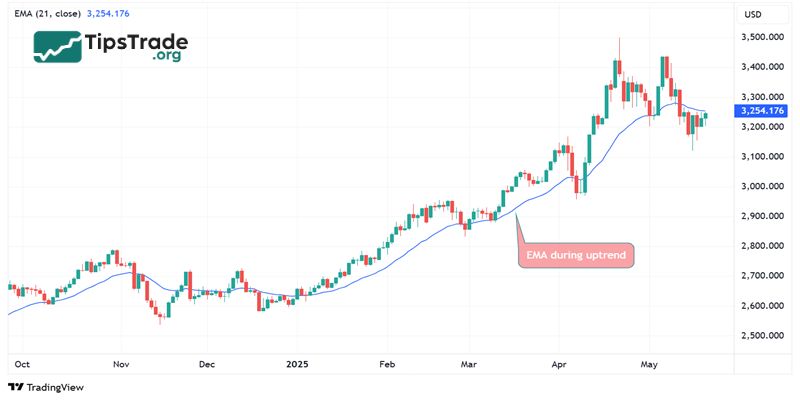
Spotting trends with EMA
The Exponential Moving Average is a popular indicator for trend trading. It clearly shows the market’s direction.
- During an uptrend, the price consistently stays above the Exponential Moving Average, while the Exponential Moving Average itself keeps rising.
- In a downtrend, the price remains below the Exponential Moving Average, with the Exponential Moving Average falling.
- In sideways markets, the price crosses the Exponential Moving Average frequently, while the Exponential Moving Average stays flat or moves horizontally.
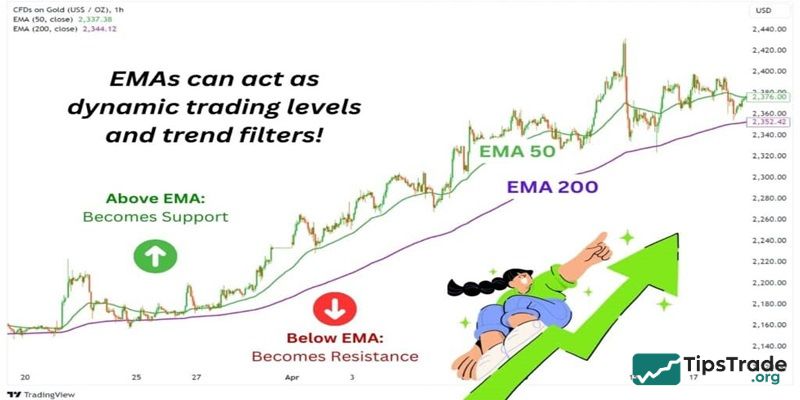
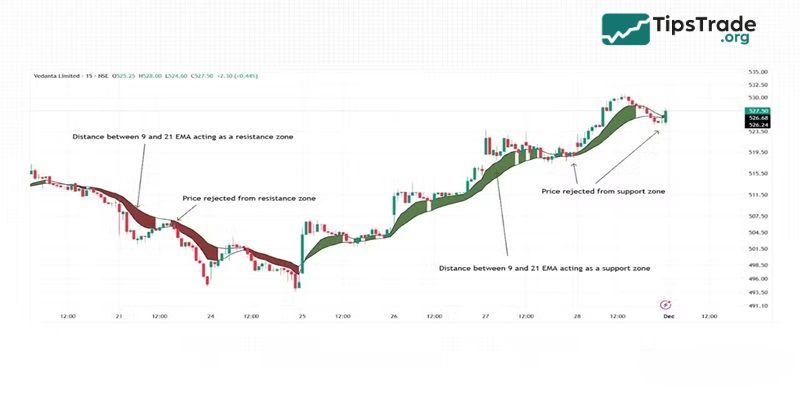
EMA as dynamic support/resistance
Unlike static support and resistance levels, the Exponential Moving Average can move along with the price and often acts as a “dynamic support or resistance” in strong trends:
- In an uptrend, if the price pulls back slightly and touches the Exponential Moving Average before bouncing up, it signals that the Exponential Moving Average is acting as dynamic support.
- In a downtrend, if the price rises and meets the Exponential Moving Average before reversing downward again, the Exponential Moving Average functions as dynamic resistance.
Entry and exit timing using EMA
One of the simple yet effective strategies is trading based on the crossover between the price and the Exponential Moving Average, or between two EMAs with different periods:
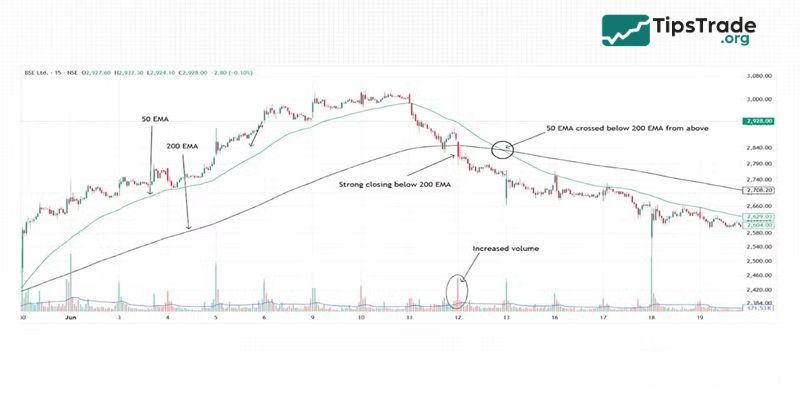
- Buy signal (Buy entry): When the price crosses above the Exponential Moving Average from below, or when a short-term Exponential Moving Average (e.g., EMA20) crosses above a longer-term Exponential Moving Average (e.g., EMA50). This usually indicates that the market is shifting from a downtrend to an uptrend.
- Sell signal (Sell entry): Conversely, when the price crosses below the Exponential Moving Average, or when a short-term Exponential Moving Average crosses below a longer-term Exponential Moving Average, the market may be entering a downtrend.
Difference between EMA and SMA
Exponential moving average and simple moving average are similar in that they are used to measure trends. Another similarity between the two indicators is that they are used to smooth price fluctuations in a trade and both follow the same principles. However, some differences exist between the two indicators:
| Criteria | Exponential Moving Average | Simple Moving Average |
|---|---|---|
| Calculation Method | The Exponential Moving Average calculates the average price of an asset with greater weight given to more recent data, resulting in a faster response to current price movements. | SMA calculates the average price of an asset by summing all values over a period and dividing by the number of periods, with each value contributing equally. |
| Reaction to Price | Responds quickly to recent price changes, making it suitable for traders aiming to catch short-term trends. | Reacts more slowly compared to the Exponential Moving Average, suitable for identifying longer-term trends. |
| Complexity | More complex due to weighted calculation and requiring longer historical data to accurately reflect trends. | Easy to understand and calculate, simply averaging historical values. |
| Common Usage | Often used in short-term trading strategies where quick responses to price movements are important. | Common in long-term trading strategies, where overall trends are considered rather than short-term fluctuations. |
| Advantages | Quickly detects changes in price trends, helping traders act in a timely manner. | More stable, less affected by short-term price fluctuations, helping maintain smoother trend analysis. |
| Disadvantages | Can be affected by short-term price fluctuations, potentially leading to false trading signals in some cases. | Reacts slowly to changes in price trends, potentially causing missed trading opportunities. |
Tips for traders on optimising EMA usage
Every indicator has its own advantages and limitations. Therefore, investors need to understand its nature to avoid unwanted risks when trading in financial markets. Here are some points to keep in mind when using the Exponential Moving Average:
- The Exponential Moving Average may be accurate at one moment but can produce noisy signals at another.
- The clearer the market trend, the more effective the EMA. It is less effective in a sideways (consolidating) market.
- When prices are rising strongly, it is recommended to use a short-term Exponential Moving Average to timely identify suitable entry points.
- Using too many Exponential Moving Average on the same chart can confuse investors, as they have to process multiple signals simultaneously.
- The Exponential Moving Average is calculated based on historical data and does not include any forecasting element. Therefore, when the market moves according to support and resistance principles, it is easier to evaluate the EMA’s effectiveness. Conversely, if the market does not follow these principles, assessing the EMA’s effectiveness becomes very difficult.
- It is important to distinguish between Exponential Moving Average and Simple Moving Average and understand their respective strengths and weaknesses to use them effectively.
Conclusion
Understanding and correctly applying the Exponential Moving Average not only helps traders identify market trends but also supports setting more effective entry and exit points. However, the Exponential Moving Average is not a “magic key” and should be combined with other technical indicators or trading volume to enhance signal confirmation. Whether you are a short-term or long-term trader, it is essential to have an investment strategy, manage risk, and optimize profits to take full control of your investment process.
See more: