
A bar chart is an important tool in stock analysis. It helps investors gain an overview of price fluctuations and trading volume. So, what is a bar chart & how to read? Let’s refer to the following article with Tipstrade.org to avoid missing out on useful knowledge!
What is bar chart?
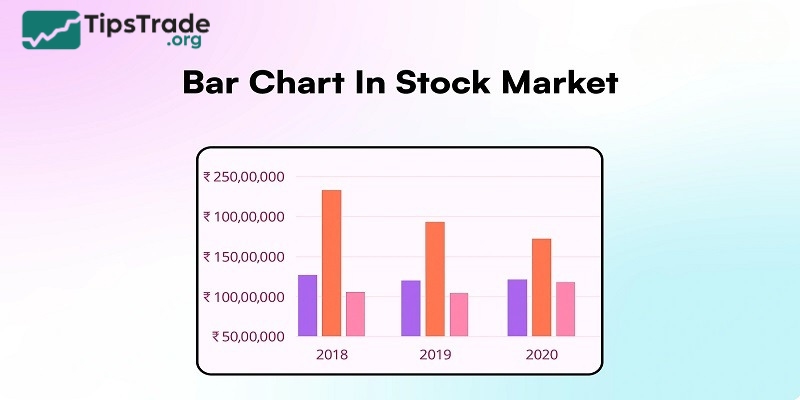
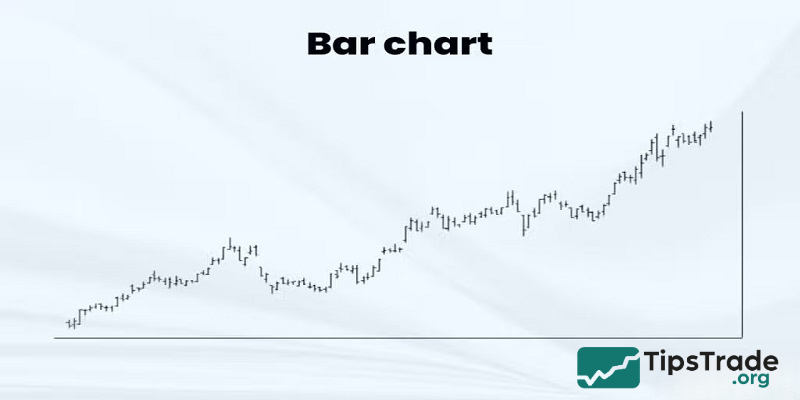
A bar chart is a type of market statistical chart. It is commonly used in stock analysis and fields related to economics and finance. This chart represents data by vertical or horizontal bars whose length represents price, trading volume, or other numerical parameters.
In a bar chart, each bar typically represents a specific period of time (e.g., a day, a week, a month).
The length of a bar represents information about the opening price, closing price, highest price, and lowest price during that time period. The bars are usually arranged side by side, forming series that represent price trends and market movements.
>>See more:
- How to Read Stock Charts Like a Professional
- Fundamental Analysis Stocks: Everything Investors Need to Know
- Technical Analysis for Stocks: The Complete Guide for Modern Investors
- Factors Affecting Stock Prices: Key Drivers Behind Share Movements
Constructing of a bar chart
Basically, bar charts are also a type of graph that shows the fluctuations of stock prices over time. Its main components include:
Coordinate axes: With the vertical axis representing stock prices and the horizontal axis representing time points.
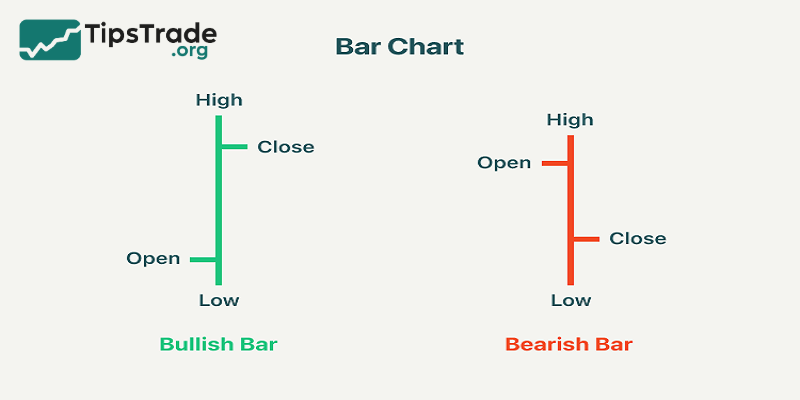
Price bars: This is the most important component of a bar chart, the price bars will show the price fluctuations of stocks over a certain period of time. Specifically as follows:
- The opening price is shown by the horizontal line to the left of the vertical bar.
- The closing price is shown by the horizontal line to the right of the vertical bar.
- The highest price in the session is shown at the highest point of the vertical bar.
- The lowest price in the session is shown at the lowest point of the vertical bar.
- Each price bar can be color-coded, usually green for bullish sessions (close higher than open) and red for bearish sessions (close lower than open)
How to read a bar chart
How to read bar charts is an important skill that helps investors and market analysts grasp information and make accurate investment decisions.
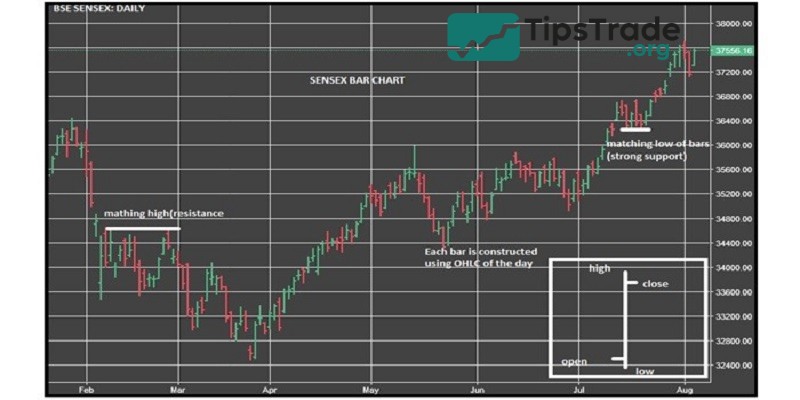
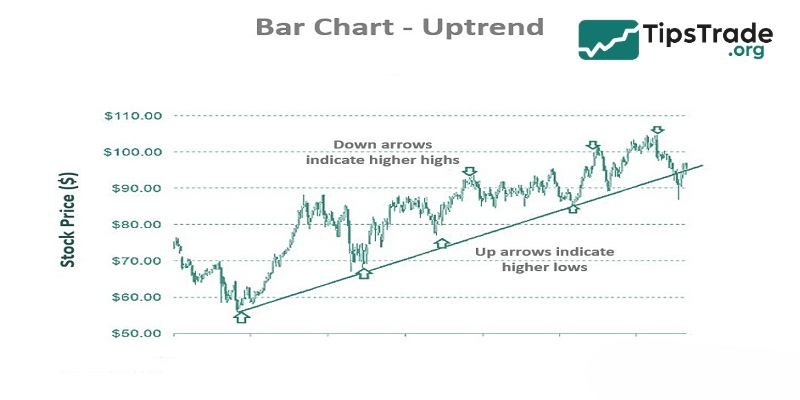
- Determine stock price trends: Look at the direction of the vertical bars on the chart to determine the price trend of the stock. If the vertical bars are pointing up, it is an uptrend. Conversely, if they are pointing down, it is a downtrend.
- Evaluate price movements over time: Compare the length and height of vertical bars to gauge price movements over a period of time. Long and volatile vertical bars represent large price movements.
- Identify the basic price model: Analyze the changes in vertical bars to recognize basic price patterns such as uptrend, downtrend, or sideways.
- Observe the relationship between price and trading volume: Look at trading volume on the chart to gauge investor interest and participation. The relationship between price and volume can indicate strong support or resistance.
Tips and techniques for reading a bar chart
First, focus on determining the trend of the stock price. Look at the direction of the vertical bars to see if there is an uptrend, downtrend, or sideways trend. Look for continuity and agreement between the bars to determine the main trend of the market.
Next, read the price patterns on the chart. Analyze the patterns formed by the bars to identify basic price patterns. Such as reversal candlesticks or continuation candlesticks. These patterns can provide important signals about the potential price trend.
Additionally, use technical tools like moving averages, MACD or RSI to enhance your chart reading skills. These tools help identify signals to buy or sell stocks based on indicators calculated from chart data.
How to use bar charts in the stock market?
Bar charts serve as the foundation for many trading strategies. Here are some ways investors can use them:
- Identify the trend: Bar charts help investors identify whether an asset is in an uptrend, downtrend, or accumulation phase.
- Identify entry and exit points: Patterns like reversals and breakouts show the optimal time to open or close a trade.
- Risk management: Combining bar patterns with stop loss orders helps investors protect positions against adverse price movements.
- Confirm other indicators: Bar charts can be used in conjunction with technical indicators such as moving averages (MA) and RSI to confirm market trends.
Benefits and limitations of bar charts
Benefits of bar charts
- Clarity: Bar charts provide a clear and detailed representation of price data. Each bar contains important information about the asset’s price movements, including the opening price, the highest price, the lowest price, and the closing price over a given time frame. This comprehensive view makes it easy for traders to quickly interpret the market situation.
- Flexibility: One of the great features of bar charts is their adaptability to different trading styles and time frames. Traders can customize bar charts to analyze data from short time frames such as minutes for high-frequency trading to long time frames such as months for long-term investment strategies.
- Predictability: Bar patterns, i.e. special arrangements of bars on a chart, are powerful tools for predicting potential market trends. Patterns such as “inside bar”, “outside bar” or reversal patterns provide insight into trends, accumulation phases and possible price reversals.
Limitations of bar charts
- Complexity: Interpreting bar charts requires a lot of experience and expertise. Beginners may have difficulty understanding and accurately analyzing price movements, leading to the possibility of misinterpreting signals or making ineffective trading decisions.
- False signal: In highly volatile or sideways markets, bar patterns can often produce false signals. These misleading signals can cause traders to enter or exit trades at inopportune times, affecting profits.
- Dependency: Relying solely on bar patterns without incorporating other technical or fundamental analysis tools can increase trading risk. This reliance can lead to inaccurate predictions and suboptimal trading results.
Comparing bar charts and candlestick charts
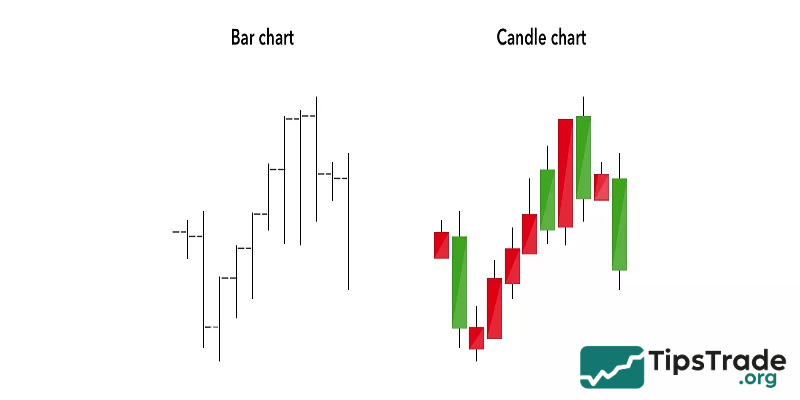
A bar chart is very similar to a Japanese candlestick chart. The two types of charts display the same information but in different ways.
|
Criteria |
Bar Chart |
Candlestick Chart |
|
Display Method |
Uses vertical bars to represent the opening price (left tick), closing price (right tick), and the high and low prices during the session. |
Uses “candles” consisting of a body (the distance between the open and close prices) and upper/lower wicks (the highest and lowest prices). |
|
Color Scheme |
May use red and green to indicate price decrease or increase, but the colors are usually less prominent. |
Distinct colors clearly show trends: green (up), red (down), with customizable color options. |
|
Displayed Information |
Shows the open, close, high, and low prices within a session. |
Provides complete information on open, close, high, and low prices, with clear visual representation of market movements through candle bodies and wicks. |
|
Visual Clarity |
Easy to read but less visually intuitive than candlestick charts. |
Highly visual, allowing traders to quickly identify market conditions, trends, and investor sentiment. |
|
Pattern Analysis Capability |
Can be used for pattern analysis but is more limited. |
More suitable for identifying distinctive candlestick patterns (such as Doji, Hammer, Engulfing, etc.) and reversal signals. |
|
Common Applications |
Commonly used in traditional and classical technical analysis. |
Very popular in modern trading, especially in forex, stock, and crypto markets. |
|
Regional Popularity |
More preferred in Western countries and traditional markets. |
Originated in Japan and is now widely used worldwide. |
|
Reading Complexity |
Simple to read, but harder to quickly identify trends during high market volatility. |
Provides clear signals, easy trend recognition, and convenient for traders of all skill levels. |
Conclusion
As can be seen, the bar chart helps investors easily perceive the price fluctuations in the market. From there, they apply appropriate TA and FA analysis methods to optimize their trading positions. Don’t forget to follow Tipstrade.org to continue receiving useful information about stock market investment!
See more: