
The Doji candlestick pattern is one of the Japanese candlestick patterns that is no longer unfamiliar to traders when conducting technical analysis in financial markets. Let’s join Tipstrade.org to explore what the Doji candlestick pattern is and learn about the most common types of Doji patterns so you can apply them effectively in the article below.
What is a Doji candlestick pattern?
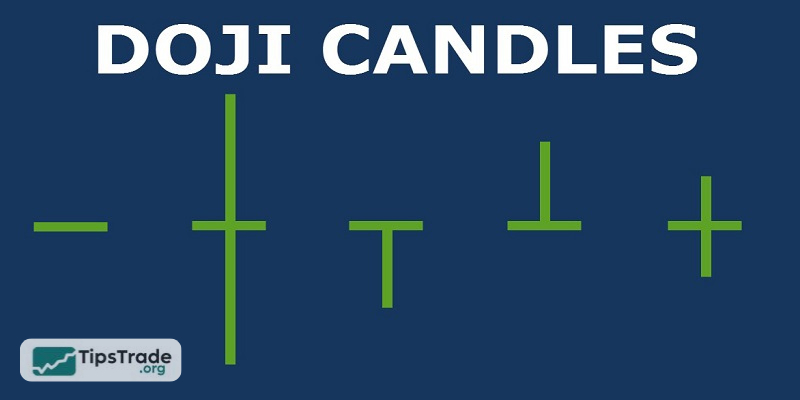
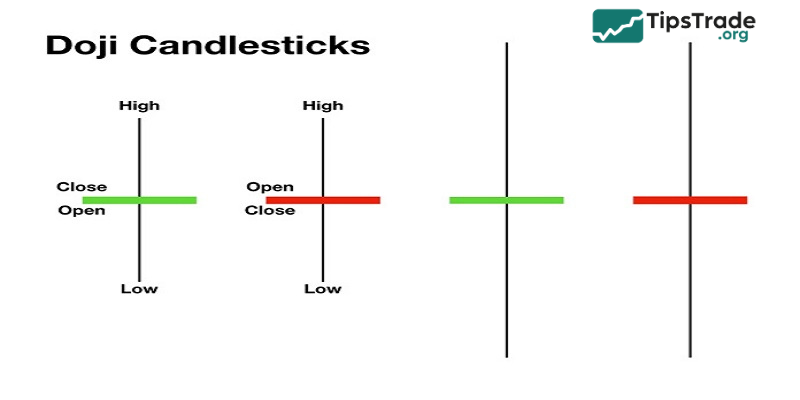
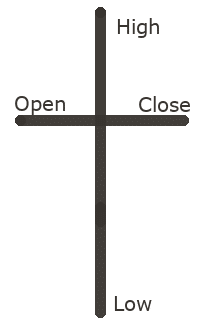
Doji candlestick pattern is a concept referring to a Japanese candlestick pattern formed when the opening and closing prices are equal. The shape of a Doji candlestick pattern indicates a balance shift between supply and demand, and Doji candles often resemble a cross (+). Based on the balance changes of the Doji candlestick pattern, traders can make relatively accurate predictions and forecasts about future prices.
Meaning of the Doji candlestick pattern
A single Doji candle appearing represents a fierce struggle between buyers and sellers. When a Doji candle appears, it clearly indicates significant indecision from both sides, often described as the calm before the storm. Observing previous price charts and the timing of the Doji candle’s appearance will help you recognize early warnings of future price spikes.
In some rare cases, there may be 2 or 3 Doji candles appearing, which is a signal of a strong market trend reversal. This is also an opportunity for traders to make important decisions.
Common types of Doji candlestick patterns
Below are some common and popular types of Doji candles currently seen in the market:
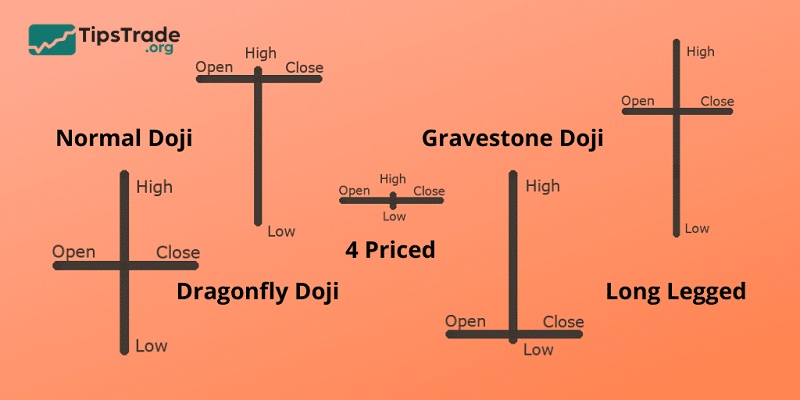
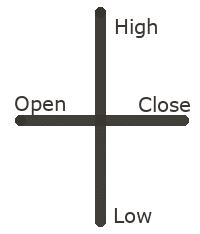
Normal Doji
This is the most basic Doji candlestick pattern you can recognize, however, it often doesn’t provide specific trading signals. When analyzing price, traders need to incorporate additional signals. A basic Doji candlestick pattern generally indicates market indecision. When making a decision in this situation, you need to consider previous price movements for additional context.
Identifying characteristics: A standard Doji candlestick pattern is usually thin and flat, with the upper and lower shadows and wicks being almost equal in length (resembling a balanced plus sign).
Long-Legged Doji
A long-legged Doji candle is a pattern where the closing and opening prices are relatively close, and the candle shadows tend to be long. Unlike the standard Doji candlestick pattern, the long-legged Doji candle indicates a fierce struggle between buyers and sellers, but the outcome remains inconclusive. This hesitation indicates a weakening market trend, potentially leading to a strong reversal with a clear upward/downward trend, evident in strong support and resistance zones.
Dragonfly Doji
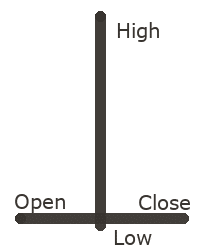
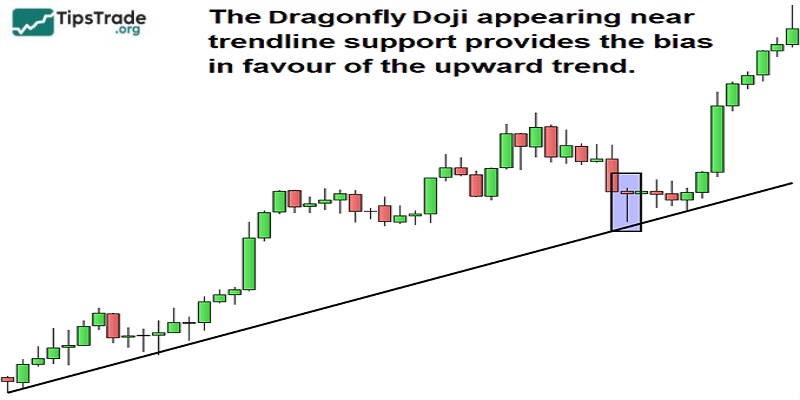
The dragonfly Doji candle is a candlestick pattern with a very short or almost non-existent upper shadow, while the lower shadow is usually long. The dragonfly Doji candle appears at the bottom of a downtrend, signaling a reversal from a downtrend to an uptrend. The dragonfly Doji candle represents the buyers’ effort to push the price higher.

Gravestone Doji
Gravestone Doji candles are often shaped like an inverted T, with a long upper shadow and a lower shadow that is almost non-existent, indicating that the opening and closing prices are equal to the lowest price. The gravestone Doji candle is the complete opposite of the dragonfly Doji candle; it indicates a reversal of the price trend from up to down and often appears at the peak of a price rally.
Four-Price Doji
This is a special Japanese candlestick pattern where there are no wicks, and the closing and opening prices are nearly equal. This is a candlestick pattern that doesn’t signal anything. When this pattern appears, the market is basically quiet, and neither sellers nor buyers show any significant action. The general psychology of traders when a four-price Doji candle appears is to be cautious and wait for volatility.

How to trade effectively with Doji candlestick pattern
Observing and recognizing the Doji candlestick pattern is relatively simple. Therefore, the trading method based on the Doji candlestick pattern is considered a classic but effective method. There are many different ways to trade with the Doji candlestick pattern, and each method reflects its own unique perspectives. However, relying solely on Doji candles is not enough information and basis for making decisions, so you need to combine a few other technical indicators to increase the certainty of each trade. Here is the basic Doji candlestick pattern trading process for your reference:
- Step 1: Observe the chart and identify the location where the Doji candlestick pattern appears.
- Step 2: Determine the direction of the market trend based on the Doji candlestick pattern you recognize.
- Step 3: Combine the assessment from step 2 with 2 or 3 other reliable indicators to predict the potential for market reversal.
- Step 4: Based on the conclusions from steps 2 and 3, make a judgment about the trend, then observe a few more candles to increase certainty.
- Step 5: Enter the order and wait for the result.
- Step 6: Analyze and draw lessons after each transaction.
Combining the Doji candlestick pattern with indicators to increase reliability
The Doji candle provides the opening and closing prices but also contains the psychological meaning of investment in each transaction. Experts and investors analyze a candle to make judgments about investor sentiment during that session: indecisive, explosive, or cautious, wary.
However, this is not yet a complete and accurate basis for making decisions on the position and trading price. This is when you need the support of indicators. Indicators will help to more clearly determine the market trend, the price points to trade, and the appropriate timing for trading,…
Some indicators that you can combine to identify trades more accurately:
Combining the Doji candlestick pattern with RSI, MACD, Stochastic,…
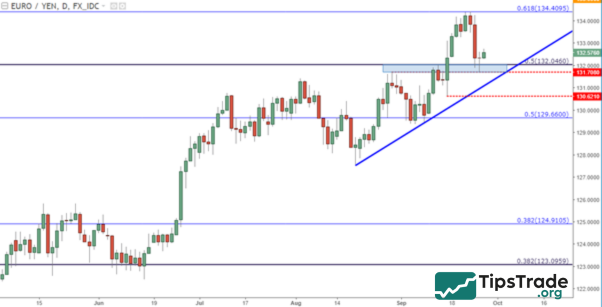
In practice, you can combine Doji candlestick analysis with momentum indicators such as RSI, MACD, Stochastic, and others. These momentum indicators help identify overbought and oversold zones, detect divergence or convergence signals, and assess the balance of power between buyers and sellers. When combined with Doji candlesticks, you can better determine whether the market is likely to reverse, continue an uptrend or downtrend, or move sideways.
The RSI indicator is particularly notable, as it is effective in identifying potential trend reversals when price enters overbought or oversold territory. At such times, applying Doji candlestick analysis together with RSI can help you pinpoint optimal entry points and achieve better short-term pricing.
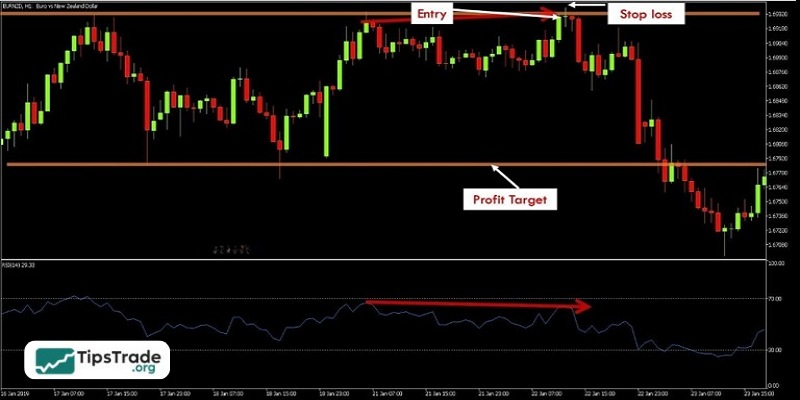
Above is an example of a trade combining the Doji candlestick pattern and the divergence signal from the RSI indicator.
Combining the Doji candlestick pattern with support/resistance levels
Forex traders are certainly familiar with support and resistance levels. Combining these zones with technical indicators is also a common practice. At strong support and resistance levels, trend reversals often occur when price breaks through a support or resistance line but fails to sustain the move. In these areas, you may observe multiple pullbacks, breakdowns, or false breakouts; however, if it is a retest, genuine signals are more likely to appear.
When combining support and resistance levels with Doji candlesticks, you can gain greater confidence in reversal signals, thereby identifying more appropriate entry timing and price levels.
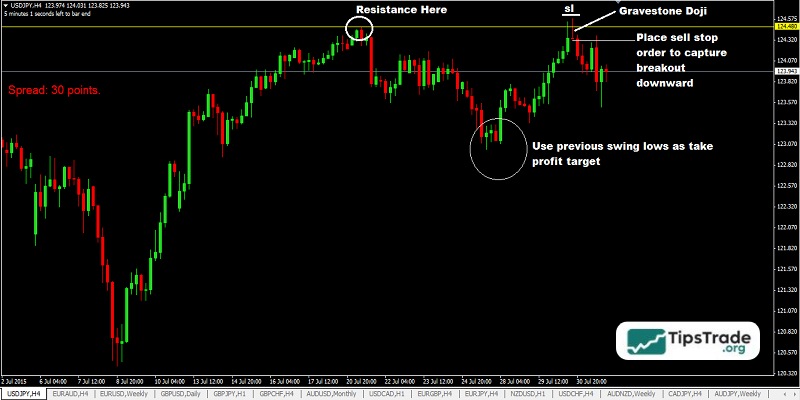
The example above illustrates a Gravestone Doji trading setup combined with a resistance level, with the stop loss placed just above the Doji candlestick and the take profit set at the nearest previous low.
In addition, you can combine Doji candlestick analysis with other indicators to filter out noise and ensure more accurate trading decisions.
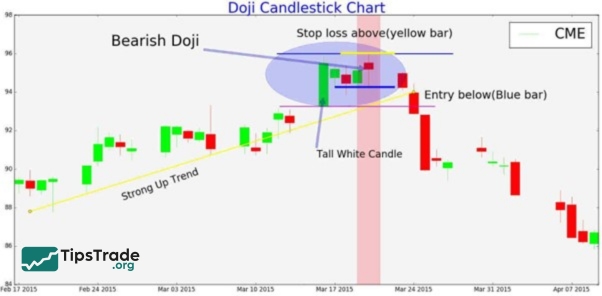
The Doji candlestick pattern in trend trading
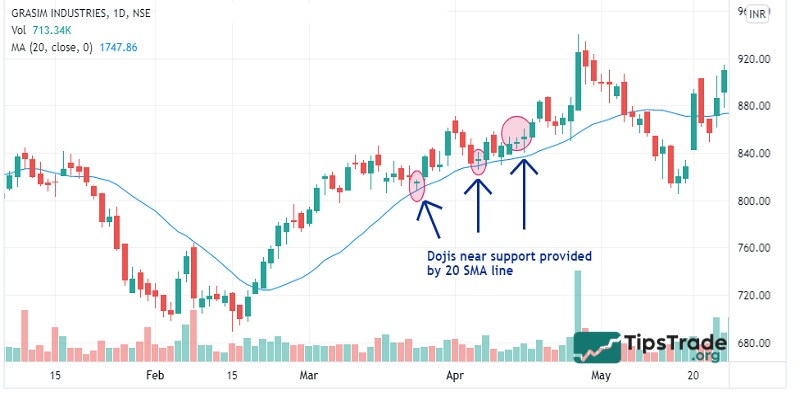
The market is in a dominant uptrend. You can wait for a Doji candlestick pattern during a pullback to enter a BUY order following the main wave’s upward movement. For example:
The moving average (MA) acts as a support zone in an uptrending market. Each time a Doji candle appears after the price drops toward the moving average, it can be used to enter the trending market.
Notes when trading with the Doji candlestick pattern
Do not trade solely based on predictions derived from the Doji candlestick patterns you identify. Doji candles often do not provide all the information needed to make a trading decision. If you are familiar with probability and statistics, you will understand that for any variable, achieving 100% accuracy is extremely difficult. Even when a prediction is correct 90% of the time, there is still a 10% chance of failure. Moreover, the formation of a Doji candlestick depends on actual market supply and demand, making it very difficult to trade mechanically based only on basic Doji candlestick knowledge and still achieve consistent results.
Use additional factors in your analysis. The Doji candlestick should be considered a necessary condition for a potential market prediction or action. The indicators and support/resistance levels you identify serve as sufficient conditions, giving you a solid basis before making a decision. However, there is no need to overuse indicators. Ask yourself questions and form hypotheses for each scenario, then carefully evaluate them to find the approach that suits you best.
If you experience a setback, do not be discouraged. Trading with Doji candlesticks is just one of many methods you can explore on your path to becoming a professional trader. Actively test different strategies before choosing the one that best fits you for long-term commitment.
Final thoughts
Hopefully the article above has provided readers with a concise and focused overview of what the Doji candlestick pattern is, as well as the most common types of Doji candlestick patterns used in trading and investment. Don’t forget to follow Tipstrade.org daily to learn more about effective technical analysis methods and investment strategies for traders and investors.