
What is a candlestick? Candlesticks are one of the most important technical analysis tools in financial trading and are widely used across markets such as forex, stocks, cryptocurrencies, and commodities. This article provides a comprehensive overview of candlesticks – from the basic concept and structure to how to read them, common candlestick patterns, and practical applications in trading. Let’s explore the details together!
What is a candlestick?
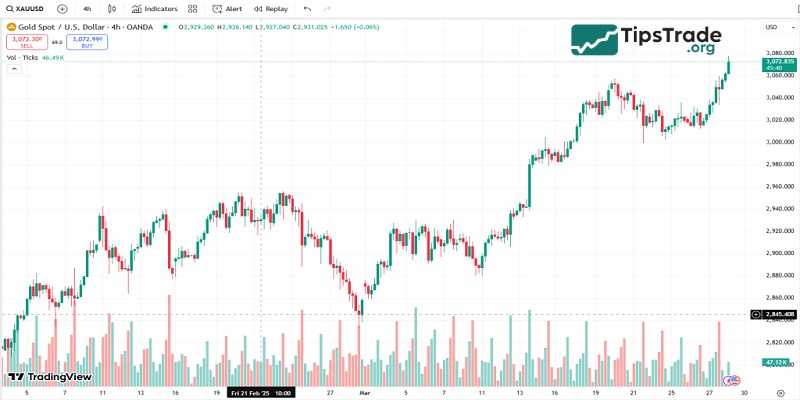
What is a candlestick?A candlestick is a type of price chart that displays price movements within a specific time frame (such as 1 second, 1 minute, 15 minutes, 1 hour, 4 hours, 1 day, 1 week, etc.). Each candlestick provides four key pieces of information:
- Open price: The price at the beginning of the trading session.
- Close price: The price at the end of the trading session.
- High price: The highest price reached during the session.
- Low price: The lowest price recorded during the session.
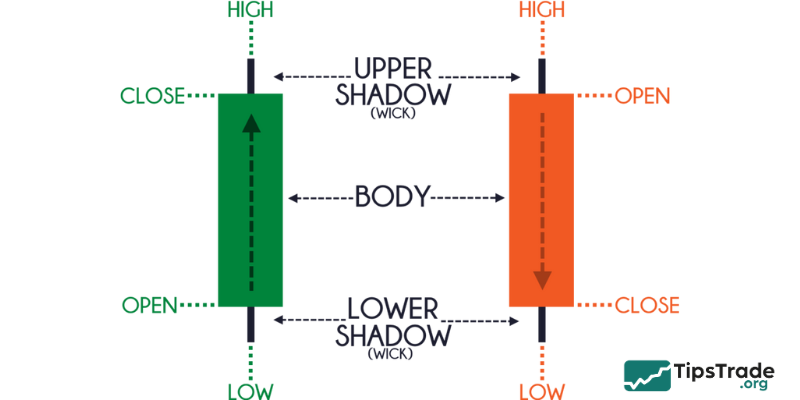
Structure of a candlestick
- Body: The rectangular part between the opening price and the closing price. A long body indicates strong buying or selling pressure, while a short body reflects market balance or indecision.
- Wick / Shadow: The thin lines above and below the body, representing the highest and lowest prices reached during the session. Long wicks often indicate price rejection.
- Color:
- Bullish candlestick: The closing price is higher than the opening price, usually shown in green or white.
- Bearish candlestick: The closing price is lower than the opening price, usually shown in red or black.
The psychological meaning behind candlesticks
What is a candlestick? Candlesticks are not just data; they also tell the story of market behavior. A long bullish candle indicates buyers are in control, a long bearish candle signals sellers are in charge, and a long candle wick shows a tug-of-war between the two sides.
History of candlesticks
What is a candlestick? Candlesticks were invented by Munehisa Homma, a Japanese rice trader, in the 18th century at the Dojima market in Osaka, Japan. Homma realized that rice prices were influenced not only by supply and demand but also by the psychology of market participants. He developed candlestick charts to record and analyze prices, enabling him to predict trends and achieve remarkable financial success.
In the 20th century, Steve Nison, an American market analyst, introduced Japanese candlesticks to the Western world through his book Japanese Candlestick Charting Techniques. Since then, Japanese candlesticks have become an indispensable tool in global trading.
How to read candlesticks
What is a candlestick? To use candlestick charts effectively, you need to understand how to read each component:
- Long body:
- Bullish candlestick: Buyers are in control, indicating a strong upward trend.
- Bearish candlestick: Sellers dominate, signaling a clear downward trend.
- Short body: The market is indecisive, with no side clearly in control.
- Long upper wick: Prices moved higher but were pushed back down, showing selling pressure.
- Long lower wick: Prices dropped sharply but were pulled back up, indicating strong buying interest.
- No wicks (Marubozu): An extremely strong trend with little to no resistance.
<=> Understanding these elements helps you “hear” the story the market is telling.
Common candlestick patterns for trading
What is a candlestick? Candlesticks form patterns that provide valuable trading signals. Below is a detailed list of the top popular candlestick patterns:
Single candlestick patterns
Doji
- Characteristics: The opening and closing prices are nearly the same, resulting in a very small body.
- Meaning: Indicates market indecision. After a strong trend, it may signal a potential reversal.
- Variations:
- Long-Legged Doji: Long wicks, showing strong market indecision and intense tug-of-war.
- Dragonfly Doji: A long lower wick, often signaling a bullish reversal.
- Gravestone Doji: A long upper wick, often signaling a bearish reversal.

Marubozu
- Characteristics: No shadow, closing price equal to the highest price (bullish) or the lowest price (bearish).
- Meaning: Extremely strong trend, no significant resistance.
- Example: A bullish Marubozu at the bottom of a downtrend may signal a reversal.

Hammer
- Characteristics: Short body, lower shadow 2-3 times longer than the body, upper shadow small or nonexistent.
- Meaning: At the bottom of a downtrend, signaling a reversal to the upside due to buying pressure pushing the price up.
- Note: A confirming bullish candle is needed.

Hanging Man
- Characteristics: Similar to Hammer but at the peak of an uptrend.
- Meaning: Signals a bearish reversal, selling pressure appears after the price reaches the peak.
- Note: Confirmed by the next bearish candle.

Shooting Star
- Characteristics: Short body, upper shadow is 2-3 times longer than the body, lower shadow is small or nonexistent.
- Meaning: At the peak of an uptrend, it signals a decline due to price rejection.
- Note: More effective at resistance zones.

Inverted Hammer
- Characteristics: Short body, long upper shadow, small or no lower shadow.
- Meaning: At the bottom of a downtrend, signaling a reversal to the upside.
- Difference: Long upper shadow instead of a lower one like the Hammer.

Spinning Top
- Characteristics: Small candle body, long upper and lower shadows nearly equal in length.
- Meaning: Represents hesitation, a balance between buying and selling. After a strong trend, it can signal a reversal or continuation depending on the context.
- Note: The next candle is needed to confirm the direction.

Double candlestick patterns
Bullish Engulfing
- Characteristics: A large bullish candle completely covers the previous bearish candle.
- Meaning: Signals an upward trend, with buying pressure dominating after a period of decline.
- Application: Effective in support zones.

Bearish Engulfing
- Characteristics: A large bearish candle engulfs the previous bullish candle.
- Meaning: Signals a downtrend, with selling pressure dominating after a period of increase.
- Application: Often found in resistance areas.

Tweezer Tops
- Characteristics: Two candles with equal highs (bullish candle + bearish candle), long upper shadow.
- Meaning: Price is rejected at a high level, signaling a bearish reversal.
- Note: Decreased volume on the second candle increases reliability.

Tweezer Bottoms
- Characteristics: Two candles with equal lows (bearish candle + bullish candle), long lower shadow.
- Meaning: Price is rejected at a low level, signaling a bullish reversal.
- Note: Confirmed by the next bullish candle.

Harami
- Characteristics: The first candle is large (either bullish or bearish), and the second candle is small, contained within the body of the first candle.
- Bullish Harami: A large bearish candle followed by a small bullish candle, signaling a potential upward reversal.
- Bearish Harami: A large bullish candle followed by a small bearish candle, signaling a potential downward reversal.
- Note: More effective at support/resistance levels, a third candle is needed for confirmation.

Homing Pigeon
- Characteristics: Two bearish candles, the second candle is smaller and within the body of the first candle.
- Meaning: Signals a bullish reversal after a downtrend, selling pressure weakens.
- Difference from Harami: Both candles are bearish, not one bullish and one bearish.
- Note: Usually at the bottom, requires a confirming bullish candle.
Three candlestick patterns
Morning Star
- Characteristics: Bearish candle – short candle/Doji – bullish long candle.
- Meaning: Signals a bullish reversal after a downtrend, buying pressure returns.
- Note: The third candle needs to close above 50% of the first candle.

Evening Star
- Characteristics: Bullish candle – short candle/Doji – long bearish candle.
- Meaning: Signals a bearish reversal after an uptrend, with selling pressure dominating.
- Note: More effective at resistance levels.

Three White Soldiers
- Characteristics: Three consecutive bullish candles, long body, short wicks.
- Meaning: Confirms a strong upward trend, continuous buying pressure.
- Note: May be overbought if RSI is high.

Three Black Crows
- Characteristics: Three consecutive bearish candles, long body, short wicks.
- Meaning: Confirms a strong downtrend, overwhelming selling pressure.
- Note: Usually follows a prolonged uptrend.

Three Inside Up
- Characteristics: Large bearish candle – small bullish candle within the bearish body – long bullish candle.
- Meaning: Bullish reversal, buying pressure gradually gaining dominance.
- Application: Effective in support areas.

Three Inside Down
- Characteristics: Large bullish candle – small bearish candle within the bullish candle – long bearish candle.
- Meaning: Bearish reversal, selling pressure returns after an increase.
- Application: Used in resistance areas.

Rising Three Methods
- Characteristics: Long bullish candle – three small bearish candles – followed by another long bullish candle.
- Meaning: The uptrend continues after a short correction.
- Note: The three middle candles do not break the low of the first candle.

Falling Three Methods
- Characteristics: Long bearish candle – three small bullish candles – followed by another long bearish candle.
- Meaning: The downtrend continues after a short correction.
- Note: The three middle candles do not break the high of the first candle.

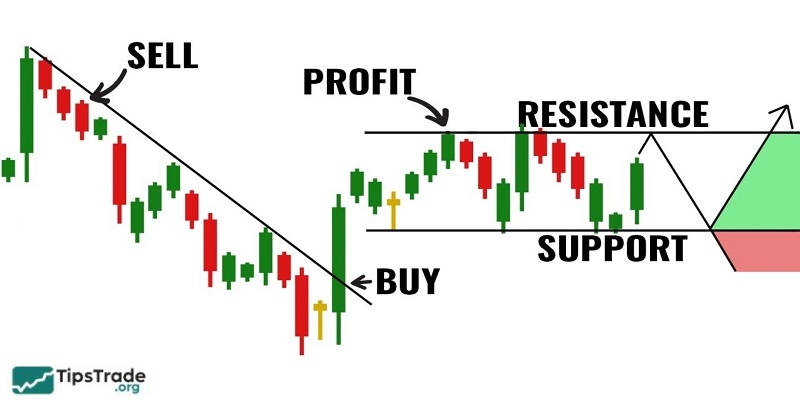
How to use candlesticks when trading
Candlestick patterns are a supporting tool, not a “crystal ball”. Below are ways to apply them effectively:
- Identify trends: Use Marubozu and Three White Soldiers to spot uptrends; Three Black Crows and Bearish Engulfing to identify downtrends.
- Find reversal points: Combine Hammer, Shooting Star, and Harami with support/resistance levels, and wait for confirmation from the next candlestick.
- Risk management: Place stop-loss orders below the Hammer’s lower wick or above the Shooting Star’s upper wick, aiming for a minimum risk-to-reward ratio of 1:2.
- Combine with other tools: Use moving averages (MA), RSI, and Fibonacci to increase reliability.
Benefits and limitations of candlesticks
Benefits
- Visual and intuitive: Easy to understand, suitable for both beginners and professionals.
- Reflect market psychology: Help capture market sentiment and emotions.
- Versatile: Applicable across all time frames and markets.
Limitations
- Noisy signals: On shorter time frames, false signals are more likely to occur.
- Not standalone: Should be combined with other indicators for confirmation.
- Experience-dependent: Accurate candlestick reading requires practice and experience.
Advanced tips for using candlesticks
- Choose the appropriate time frame: Scalpers typically use M1–M15, while swing traders prefer H1–D1.
- Observe volume: Candlesticks with high volume are generally more reliable.
- Avoid major news events: Strong volatility can distort candlestick signals.
- Use Heikin Ashi: Helps filter out noise and identify trends more clearly.
- Backtest: Review historical data to evaluate the effectiveness of candlestick patterns.
Conclusion
What is a candlestick? Candlestick patterns are an indispensable “companion” for traders. From simple patterns such as Doji and Spinning Top to more complex ones like Harami, Homing Pigeon, and Three White Soldiers, candlesticks provide powerful insights into trend direction and potential reversal points. However, to achieve consistent success, traders need continuous practice, sound risk management, and confirmation from other indicators. Wishing you successful trading!