
What are market trends? When trading in the financial market, you have probably heard the phrase “The trend is your friend,” right? Have you truly understood this “friend”? In this article, we will explore what market trends really are and how to effectively identify market trends through the structure of market trends.
What is a trend?
Trend is understood as an issue, an event, a direction of any specific event, thing or matter in life that receives a lot of attention and interest from many people.
Currently, trends are quite diverse and rich, each industry and field is different. Trends have different ways of expression depending on the situation and the customer group that the brand is aiming for. However, trends only attract people for a certain period of time. In addition, trends can suddenly appear and also quickly be replaced by another trend that is more interesting and attractive.

What are market trends?
Market trends are the tendency of a financial market to move in a particular direction over time. These trends are classified as secular for long-term time frames, primary for intermediate time frames, and secondary for short-term time frames. Traders identify market trends using technical analysis. A time frame characterizes market trends. As predictable price trends in the market as prices approach support and resistance levels, change over time.
Market trends will show the direction a security or group of businesses is moving in, up or down. In investment industry terms, these are called Bull Markets and Bear Markets. They describe upward and downward market trends, respectively. And can be used to describe the entire market such as stocks, bonds, commodities or individual sectors and securities. However, understanding the market trend is important for buying and selling and wanting to be successful in investing. Because, it will help identify opportunities and manage risks.
How do market trends work?
The operation of the market trends are detailed as follows:
- Government policy
Through fiscal and monetary policy, governments can slow or accelerate the development of market trends. For example, central bank interest rate adjustments can influence a country’s economic growth rate, which in turn has a direct impact on cyclical and defensive sectors.
- Market psychology
Market trends can be shaped by the psychology of market participants. When traders and investors are confident about a country’s economic prospects or a company’s business performance, their optimism can create an upward trend. Conversely, negative sentiment can push asset prices lower.
- Supply and demand
Asset prices tend to move in response to changes in the balance of supply and demand, which is particularly evident in commodities. For example, when the economy is growing strongly, demand for crude oil increases, causing prices to rise. War or disruptions to production also limit supply, which in turn pushes prices up.
- Business and economic news
Positive results in a company’s quarterly financial report or economic figures that beat expectations can contribute to an uptrend. Conversely, negative news can drag prices down, creating a downtrend.
Types of market trends
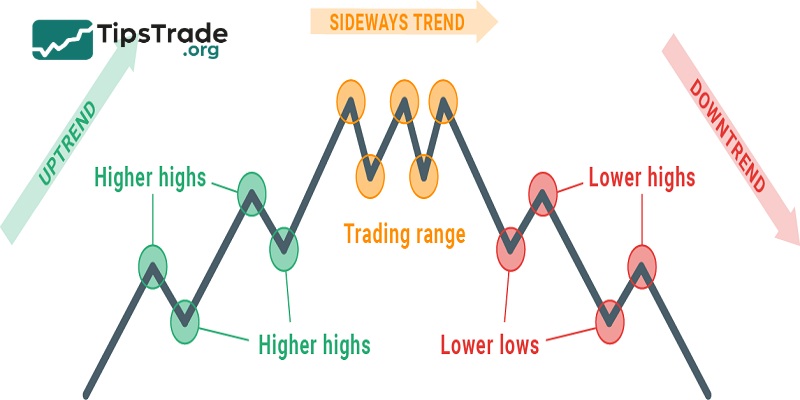
If considered over a certain period of time, market trends are divided into 3 types such as:
Uptrend
An uptrend, also known as a bull market, is a period of continuously rising prices in a product or market. Typically, an upward trend is seen as a sign of economic strength and can be driven by various factors such as strong supply, increasing profits, and favorable economic conditions.

Downtrend
A downtrend, or bear market, is a period of continuously declining prices in a product or market. Typically, a bear market is seen as a sign of economic weakness. It can be driven by various factors, such as: weakened demand, reduced profits, and unfavorable economic conditions.

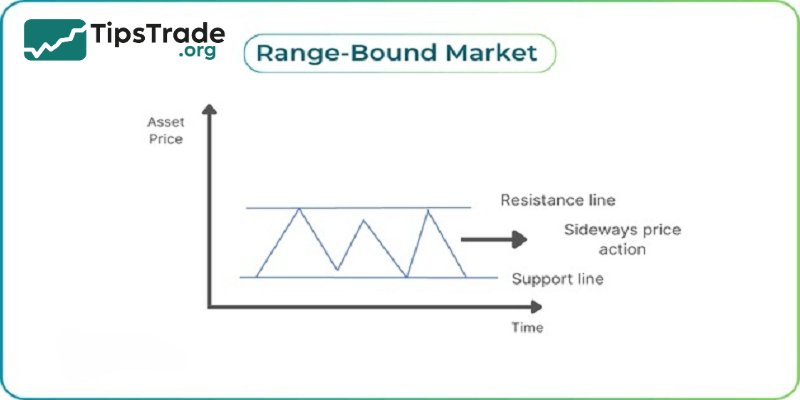
Sideways trend
A sideways trend, also called a horizontal trend or range-bound market. The sideways market is a phase where prices are relatively stable in a particular product or market. The sideways trend can be characterized by a lack of clear direction, with prices fluctuating within a relatively narrow range.
To understand what a market trend means, it is important to take into account the factors that can shape it.
How to identify market trends
In the financial market, identifying trends is an extremely important step in making sound investment decisions. To achieve this, there are three main methods commonly used: technical analysis, fundamental analysis, and market sentiment analysis. Each method has a different approach but all help to evaluate and predict price trends effectively.
Technical analysis
Technical analysis involves looking at historical price and volume data to predict future market trends. It uses charts and indicators to help you identify patterns and trends. The main elements of technical analysis include:
- Chart patterns such as head and shoulders, triangles, double tops or double bottoms can signal a trend reversal or continuation. When using chart patterns in technical analysis, it is important to remember that they do not guarantee that the market will move as predicted – they are merely suggestions of what may happen to the asset price.
- Trend line drawn on a chart to connect the lows in an uptrend or the highs in a downtrend. They help determine the direction and strength of a market trend.
- Support and resistance levels are price levels on a chart that appear to limit the range of a market’s movements. These are often points where prices tend to reverse, providing potential entry or exit opportunities. Understanding these levels helps you predict market movements and manage risk.
- Oscillator indicator includes tools like Moving Averages, RSI, and MACD (Moving Average Convergence-Divergence). These tools help you analyze market momentum, trend direction, and potential reversal points. Combining multiple indicators often provides a clearer view of market conditions.
- Volume analysis confirms the strength of a price move. When prices rise with high volume, it shows strong buying pressure; while low volume may reflect indecision. Always consider volume alongside price moves to confirm trends.

Fundamental analysis
This involves evaluating economic indicators to predict market trends. Unlike technical analysis, which focuses on price data, fundamental analysis looks at the core factors that influence the market. By understanding these indicators, you can assess the overall health of the economy.
- Macroeconomic indicators such as GDP growth, unemployment rates, and inflation provide important information about the general economic environment. Positive economic data is often associated with bullish market trends. You can use the economic calendar to prepare for data releases.
- Geopolitical events play an important role in shaping market trends. Political instability or trade tensions can lead to market volatility. Keeping up to date with global news will help you predict market volatility and adjust your strategy accordingly.
- Announcements from central banks like the US Federal Reserve (Fed), Bank of England (BoE) or European Central Bank (ECB) are also extremely important. Their policies on interest rates and monetary easing can have a strong influence on market sentiment. Keep an eye on their meeting minutes and public statements for signals on future market trends.
- The basic elements of business like earnings reports, they provide information about a company’s financial health. By analyzing profit margins, revenue growth, and the balance sheet, you can determine the potential for stock price movements. Positive earnings may suggest buying opportunities, while negative reports may indicate a potential decline.
- Different industries react differently to economic conditions. For example, technology tends to thrive during economic upturns, while utilities tend to perform well. Understanding these characteristics will help you approach fundamental analysis more holistically and make more accurate market forecasts.

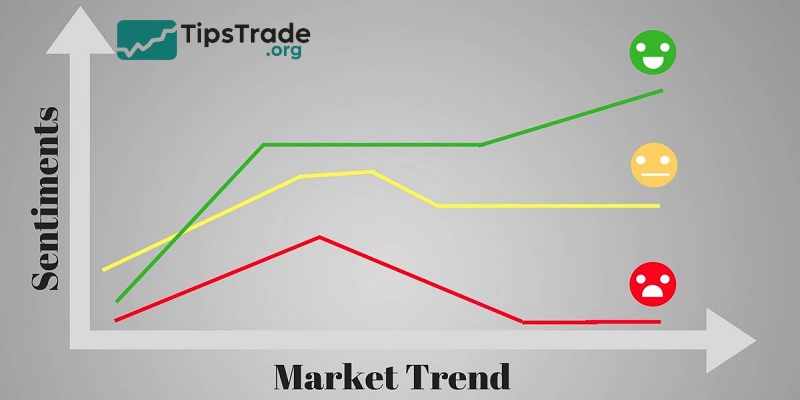
Market sentiment analysis
Market psychology analysis focuses on assessing the emotions and behaviors of investors. This is an extremely important factor in the financial market. Indicators and tools for psychological analysis include:
- Fear and Greed Index: This index measures the level of fear and greed among investors in the market. When the index shows a high level of fear, it can be a sign of a price decline or a buying opportunity. Conversely, a high level of greed can be a sign that the market is overheated and prone to a correction.
- Social media and news analysis: Social media platforms like Twitter, Reddit, and Telegram play a big role in shaping market sentiment. Investors often track discussion trends and community reactions to predict price trends. News about new regulations, hacks, or product releases can create short-term price shocks.
- FOMO and FUD Psychology: FOMO (Fear of Missing Out) is the feeling of fear of missing out, causing investors to buy when prices rise sharply. On the contrary, FUD (Fear, Uncertainty, and Doubt) is the psychology of fear, uncertainty, and doubt, which often leads to selling when there is bad news.
Combining all three methods: technical analysis, fundamental analysis and sentiment analysis will provide investors with a comprehensive view of financial market trends. This combination will not only help investors maximize profits but also manage risks effectively.
The importance of identifying market trends
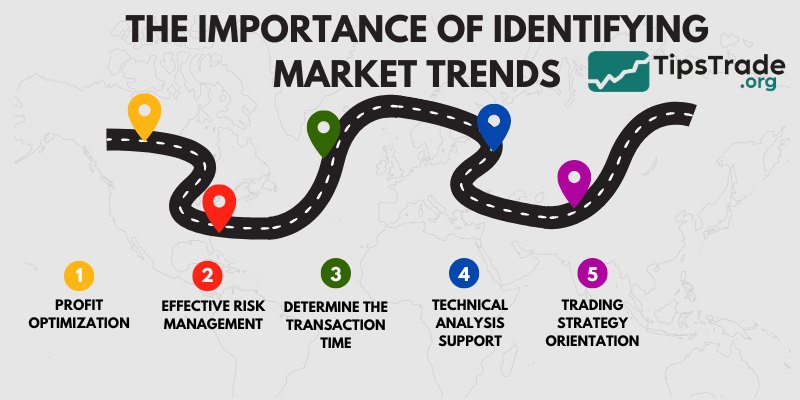
Recognizing market trends is an important skill in the financial field. Specifically, accurately identifying market trends brings the following important benefits:
- Profit optimization: Understanding the trend helps investors make the right buy or sell decisions, thereby maximizing profits. For example, in an uptrend, buying early can bring high profits as prices continue to rise.
- Effective risk management: Early recognition of a downtrend allows investors to take asset protection measures, such as placing stop-loss orders or adjusting portfolios, to minimize losses.
- Determine the transaction time: Recognizing trends helps determine the right time to enter or exit the market, avoiding decisions based on emotions or inaccurate information.
- Technical analysis support: Market trends are the foundation for many technical analysis tools, which help predict future price movements based on historical data.
- Trading strategy orientation: Understanding market trends helps investors build appropriate long-term strategies and promptly adjust to market fluctuations.
Common mistakes when identifying market trends
Despite the many tools available to help identify market trends, traders are still prone to making mistakes. Here are some common mistakes and how to avoid them:
- Confusing Trends and Short-Term Volatility:Don’t jump to conclusions about an uptrend just because of a big green candle. Check on a larger time frame.
- Skip the economic news:A Non-Farm Payrolls report can reverse the trend immediately. Always keep an eye on the economic calendar.
- Counter-trend trading:Many traders try to catch the bottom or sell the top without clear signals, leading to losses.
Solution: Be patient and wait for confirmation signals and always set stop-loss to protect capital.
Trend trading strategies
After identifying market trends, you need a specific strategy to take advantage of it. Below are two common strategies:
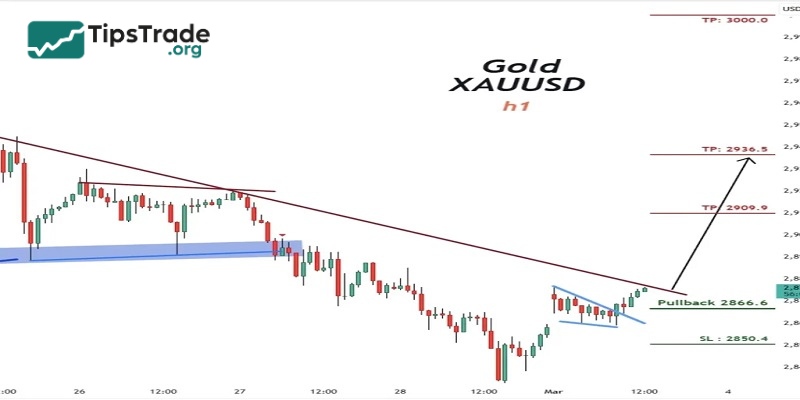
Pullback trading
- Wait for the price to pull back to the MA line or trendline in an uptrend/downtrend.
- Enter a trade when the price bounces back from the support/resistance area.
- Set the stop-loss below the nearest low (in an uptrend) or above the nearest high (in a downtrend).
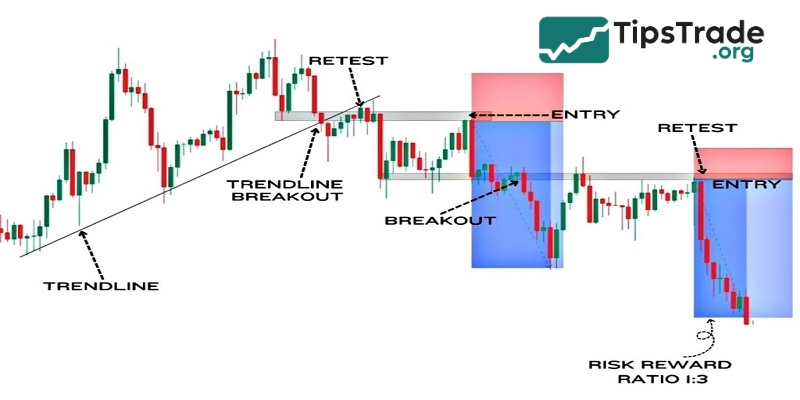
Breakout trading
- Identify the consolidation price range in the trend.
- Place a buy order when the price breaks through resistance (in an uptrend) or a sell order when it breaks through support (in a downtrend).
- Wait for a retest to confirm a valid breakout.
Conclusion
In trading, market trend is a fairly basic concept in technical analysis. However, if you do not understand what a market trend is, almost all transactions will face the risk of failure. Therefore, accurately identifying the market trend is very important for traders; it is the basis for choosing the best entry points in financial market trading strategies.