
Volume Oscillator is a fairly simple technical indicator used to track market trading volume to determine future trends. In the article below, Tipstrade.org will introduce Top 5 best of volume oscillator that you shouldn’t miss in trading. Let’s get started!
What is the volume oscillator?
The Volume Oscillator (VO) is a technical indicator used to measure the change in momentum of trading volume over time. The tool is based on the difference between two moving averages (MA) of volume: a short-term and a long-term by percentage (%). Typically, the Volume Oscillator indicator uses MA10 and MA5 or MA28 and MA14.
>>See more:
- OBV Indicator: How to Use It for Effective Trading Strategies
- How to calculate and use the MFI indicator in technical analysis
- What is the ROC Indicator and How to Use It in Trading?
- What is the CCI indicator? Formula for calculating CCI in TA
How does the volume oscillator work?
The Volume Oscillator (VO) indicator works by determining the difference between the short-term and long-term volume moving averages. This difference is expressed as a percentage. Accordingly:
- Positive VO → Short-term volume is higher → Traders are active right now.
- Negative VO → Short-term volume is lower → Market activity is cooling off.
The purpose of the Volume Oscillator is not to directly predict price, but to help confirm whether a trend is supported by actual trader participation.
Formula for calculating volume oscillator
The formula looks like this:
VO = Short term Volume MA − Long term Volume MALong term Volume MA 100
Where:
- Short-term Volume MA: This is the moving average of volume over a short amount of time, like 5 days.
- Long-term Volume MA: This is the moving average of volume over a more extended amount of time, like 20 days.
Top 5 best types of volume oscillators
Below are the five widely used and effective types of Volume Oscillators that traders shouldn’t miss:
Chaikin Money Flow (CMF)
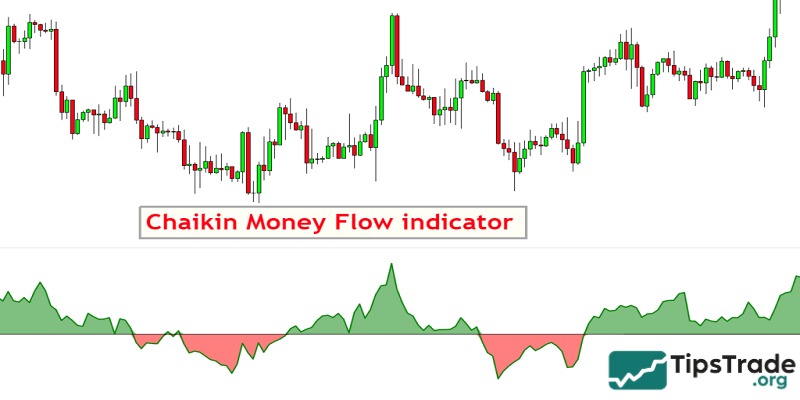
Chaikin Money Flow (CMF) is a volume-based indicator that combines both price and volume data. It is also known as the Chaikin Oscillator. This indicator determines whether an asset is being accumulated or distributed by calculating the difference between the two moving averages of the Accumulation Distribution Line (ADL).
Through the Chaikin Money Flow, traders can measure the strength of a trend and potential reversals. From there, they will gain the deepest insight into the buying and selling pressure in the market.
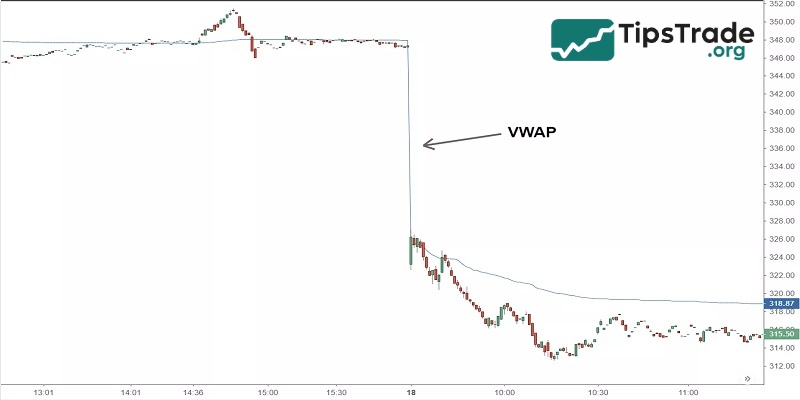
Volume Weighted Average Price (VWAP)
VWAP (Volume Weighted Average Price) is a benchmark price determined based on both price and trading volume. The purpose of this indicator is to help us understand the average price at which an asset is traded over a given period, weighted by volume at each price level.
Typically, day traders use VWAP to further confirm trading signals. It is widely used across short timeframes, and many trading algorithms are even built upon the VWAP indicator.
On-Balance Volume (OBV)
On-Balance-Volume (OBV) is a volume-based indicator that helps traders assess the cumulative volume flow relative to price movement. This indicator reflects the net cash flow into or out of an asset based on price movement.
When the closing price is higher, the volume will be added to the OBV; conversely, when the closing price is lower, the volume will be subtracted from the OBV.
OBV provides insights into potential trend divergences or confirmations in the market.

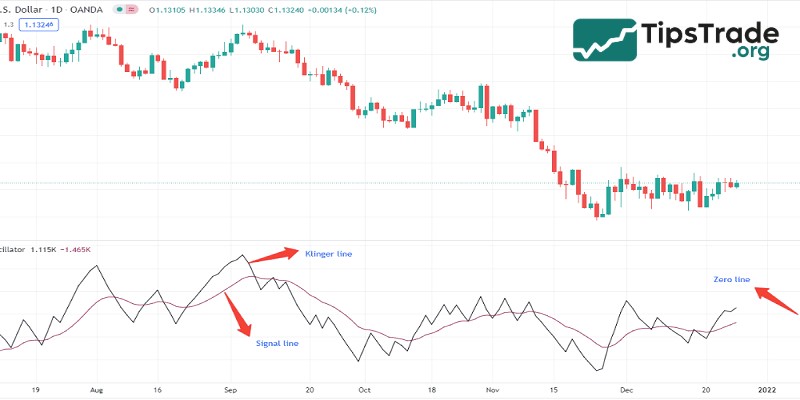
Klinger Oscillator
The Klinger Oscillator combines the direction and magnitude of trading volume to measure market momentum and trend strength. The way to calculate this indicator is to take the difference between two exponential moving averages (EMAs) of trading volume.
Through Klinger Oscillator, traders can detect changes in buying or selling pressure. From there, recognize signals of confirmation or potential trend reversal in the market.
Accumulation/Distribution Line (ADL)
The Accumulation/Distribution Line (ADL) is a volume-based indicator that shows the flow of money into or out of an asset. It is determined based on the closing price and trading volume.
When the closing price is higher than expected, the volume is added to the ADL; conversely, when the closing price is lower than expected, the volume is subtracted from the ADL.
ADL helps traders analyze the inflow and outflow of funds for an asset, thereby providing information about the potential strength or weakness of market trends.

Using the volume oscillator in technical analysis
Typically, the Volume Oscillator (VO) is rarely used independently. Instead, traders often combine VO with price movement, support and resistance levels, or trend indicators in technical analysis to make more accurate decisions.
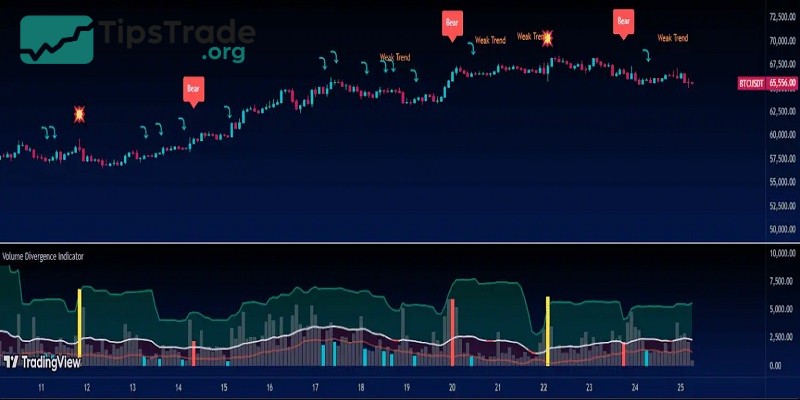
Here are some common uses of VO:
- Determine the strength of the trend: Is there significant volume behind the uptrend?
- Identifying Weak Breakouts: Price rises sharply, but VO is still negative? It could be a price trap.
- Identify potential reversal signals: The price is decreasing, but the VO is increasing, which could indicate an upcoming recovery.
Volume oscillator trading strategies
Volume Oscillator works effectively in many different markets from forex, stocks to cryptocurrencies. In particular, VO signals will be more reliable when used in combination with other tools. Below are 3 popular volume oscillator trading strategies that traders can refer to:
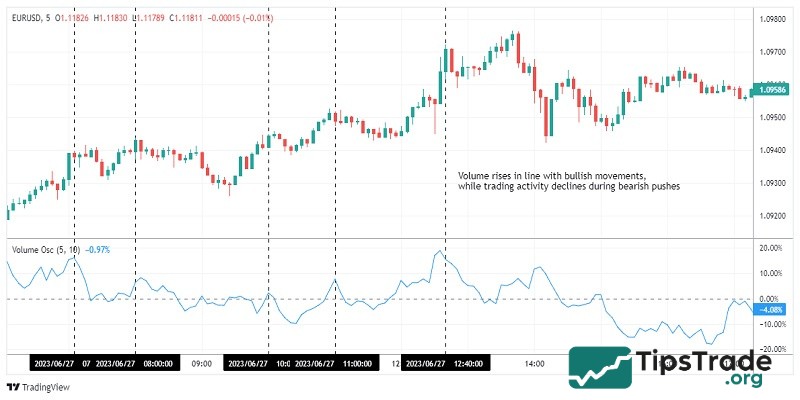
Trend confirmation with volume oscillator
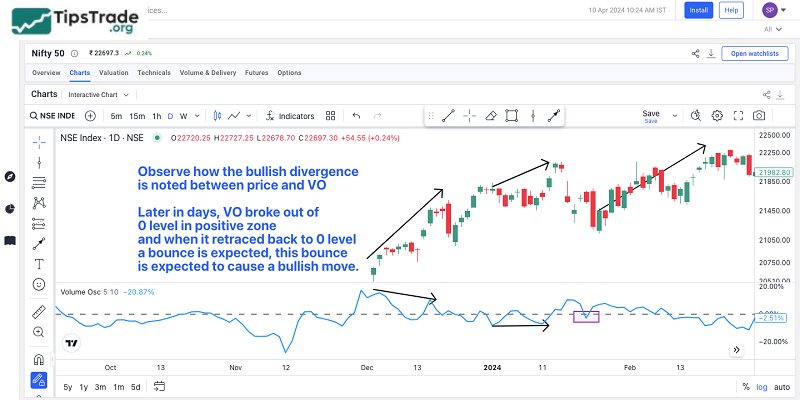
When the price and the Volume Oscillator move in the same direction, it shows that there are many people buying or selling, thereby reinforcing the current trend. This is the pattern that traders often rely on to make buying or selling decisions.
You can combine VO with other tools like Moving Averages or Parabolic SAR to get more accurate and reliable signals.
Divergence trading with volume oscillator
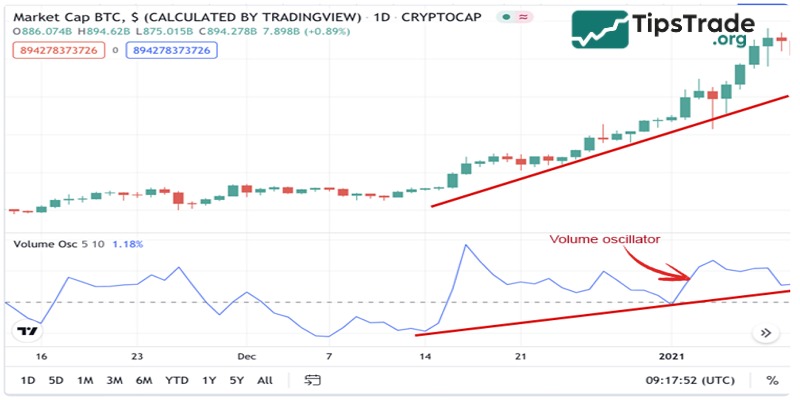
When the price moves in one direction, but the Volume Oscillator (VO) moves in the opposite direction, this is when divergence occurs. Typically, this signal helps provide information that the market momentum is weakening and a move is likely to occur.
Before making a trading decision, you should use additional oscillator indicators such as RSI or Stochastic to confirm the accuracy of this signal.
Combining volume oscillator with moving averages
By combining the Volume Oscillator with price moving averages, you can obtain stronger trading signals.
For example, when VO rises above 0 and the short-term moving average (such as the 10-day MA) crosses above the long-term moving average (such as the 50-day MA), this is a signal indicating that it’s time to buy.
This double confirmation indicates a strong trend supported by increasing trading volume. Conversely, when both cut below, it signals that selling pressure is prevailing along with increasing volume.
Additionally, this combination helps eliminate noise signals and increases the ability to participate in more sustainable trends.
Pros and cons of volume oscillator
Here are the pros and cons of the volume oscillator that traders should consider for more effective trading:
Pros of volume oscillator
- Easy to understand: Just two volume moving averages, making it simple for beginners and useful for quick analysis in intraday trading.
- Quick visual check: Positive or negative instantly tells the story without complex calculations.
- Works with other indicators: Can be combined with trend or momentum tools for stronger analysis, especially in intraday trading setups.
Cons of volume oscillator
- Doesn’t predict price direction directly.
- It can give false signals in low-volume stocks.
- Needs confirmation from other tools like RSI or MACD.
Common mistake to avoid while using the volume oscillator
To use volume oscillator more effectively in trading strategies, here are some common mistakes to avoid:
- Relying only on VO: Always combine with price action.
- Ignoring market context: A festival holiday week or budget announcement can affect volume readings.
- Overtrading small spikes: Not every rise in VO means a significant trend is coming.
Final words
Volume Oscillator (VO) is a technical analysis tool in trading used to measure the difference between two Moving Averages of trading volume. VO is used to identify increasing or decreasing trends in trading volume and can assist in making trading decisions. However, as with any other technical analysis tool, VO is not perfect and it needs to be used in conjunction with other analysis tools and methods to make accurate trading decisions. Wish you successful trading!
See more: