Volume analysis is one of the most essential yet often overlooked aspects of technical analysis. While price movements show what happened, volume shows how many participants are driving those moves, providing insights into the strength, conviction, and reliability of trends. In this guide, we will break down the principles, indicators, strategies, real-world examples, and common pitfalls of volume analysis, equipping beginners and advanced traders with actionable knowledge. Visit tipstrade.org and check out the article below for further information
What is Volume Analysis?

Definition & Why Volume Matters
Volume refers to the total number of shares, contracts, or units traded over a specific time period. In a stock market, it measures shares exchanged; in forex, it tracks contracts or tick volume; in crypto, it records token transactions.
Volume analysis interprets these numbers to understand market participation. High volume indicates strong interest in a price movement, suggesting a higher probability that the trend is valid. Conversely, low volume may signal indecision, weak trends, or the possibility of false breakouts.
For example, a breakout of a stock from a resistance level accompanied by 50% higher-than-average volume signals genuine buying pressure. Traders often consult platforms like Investopedia and TradingView to validate whether a breakout is backed by significant participation.
How Volume Reflects Market Participation
Volume acts as a confirmation tool. Markets with higher participation are less likely to reverse suddenly, while moves with low volume are more susceptible to volatility.
- High volume during uptrend: Confirms bullish momentum.
- High volume during downtrend: Confirms bearish sentiment.
- Low volume during consolidation: Indicates indecision; breakout may be fake.
For instance, in Bitcoin trading, a price rally on low volume often fails to sustain because the buying pressure is weak, even if the chart appears bullish. Real-world traders use volume as a primary signal to avoid entering false moves.
How Volume Works in Financial Markets

Volume in Stocks, Crypto, Forex
Volume behaves differently across markets due to liquidity and market structure:
- Stocks: Volume represents shares exchanged. High liquidity stocks have smoother trends; low-volume stocks are volatile
- Crypto: Volume is 24/7; markets are highly volatile. Exchanges often report volumes differently, so traders rely on aggregate sources.
- Forex: Spot forex lacks centralized volume data; tick volume is used as a proxy to understand participation.
Understanding the nuances of each market is crucial. For example, a $50 million daily volume for a small-cap stock may be huge, while the same figure in Apple stock may be negligible.
Bullish vs Bearish Volume Patterns
Volume can indicate whether buyers or sellers dominate the market:
- Bullish volume: Price rises on above-average volume. Signals strong demand.
- Bearish volume: Price falls on above-average volume. Indicates strong selling pressure.
Traders track volume spikes, often in combination with candlestick patterns, to identify potential reversals or trend continuation. A sudden increase in volume after a breakout is considered more reliable than a breakout on low volume.
Volume & Market Sentiment
Volume analysis reflects trader sentiment. High volume during price rallies shows optimism and confidence. Conversely, high volume during declines signals fear or panic selling.
Example: During the March 2020 stock market crash, the S&P 500 experienced record trading volumes as panic selling dominated. Traders who monitored volume alongside support levels avoided entering long positions prematurely, demonstrating the practical advantage of reading volume.
Key Volume-Based Indicators
On-Balance Volume (OBV)
- OBV tracks cumulative buying and selling pressure by adding volume on up days and subtracting volume on down days.
- It identifies accumulation and distribution phases, helping traders anticipate trend continuation or reversal.
Example: A rising OBV with flat price indicates accumulation. A trader might interpret this as a bullish signal before price moves higher.
Volume Moving Average
Applying a moving average to volume smooths short-term spikes and highlights longer-term trends in participation.
- 50-period volume MA: Helps identify unusually high or low volume periods.
- Traders compare current volume to the moving average to validate breakouts or reversals.
This method is particularly effective in volatile markets like crypto.
Volume Profile & Market Structure
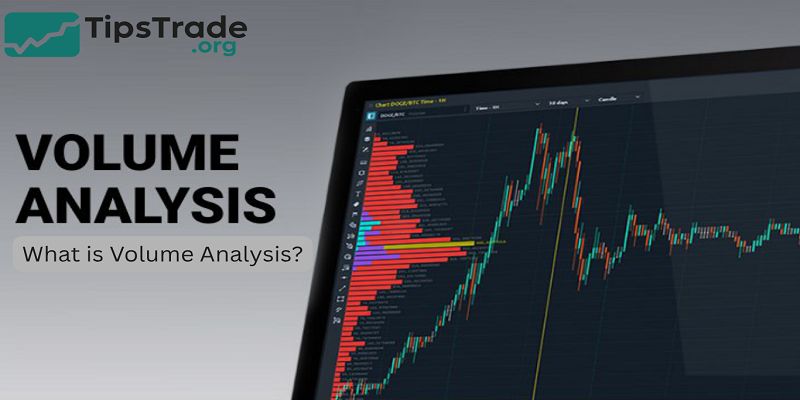
Volume Profile shows volume distribution at different price levels rather than over time. Key zones with high traded volume indicate support or resistance.
Example table:
| Price Level | Volume Traded | Significance |
| $45,000 | 150k BTC | Strong support |
| $50,000 | 200k BTC | Major resistance |
| $55,000 | 80k BTC | Weak interest |
Traders use Volume Profile to anticipate where price is likely to react and place orders accordingly.
Money Flow Index (MFI)
MFI combines price and volume to detect overbought or oversold conditions.
- MFI > 80 → overbought, potential reversal.
- MFI < 20 → oversold, potential buying opportunity.
Research shows MFI can provide early warnings before price reversals, especially when divergence occurs between price and MFI.
Volume Analysis Techniques & Strategies

Using Volume to Confirm Breakouts
Breakouts on high volume are more likely to succeed. Key steps:
- Identify support/resistance level.
- Observe volume during breakout candle.
- Confirm with retest of the broken level.
Example: A trader observing Apple breaking $150 on triple average volume waits for price to retest $150 before entering long.
Volume Divergence Signals
Volume divergence occurs when price moves in one direction while volume moves in the opposite direction.
- Price rises, volume falls: Weak rally, potential reversal.
- Price falls, volume falls: Weak decline, possible trend change.
Traders use OBV or MFI to detect divergence.
Accumulation & Distribution Patterns
- Accumulation occurs when smart money buys quietly over time, often in low-volume consolidation zones.
- Distribution is the opposite, where large holders sell gradually.
Example: A stock trading in a tight range with increasing OBV may indicate accumulation. Traders prepare for a bullish breakout.
Volume in Trend Reversals
Volume spikes often signal trend exhaustion.
- Uptrend reversal: Price peaks, volume surges, sellers dominate.
- Downtrend reversal: Price bottoms, volume spikes, buyers dominate.
Using candlestick patterns alongside volume confirms reversal points more reliably.
Real Examples of Volume in Trading
Example with Stocks
- Tesla stock in 2020 showed repeated breakouts above $400.
- Breakouts accompanied by high volume validated the trend, while breakouts on low volume failed.
Example with Crypto
Bitcoin’s $40,000–$42,000 resistance zone in 2021:
- Breakout on high volume → continuation to $48,000
- Fake breakout on low volume → price retraced to $39,000
Case Study: Fake Breakouts with Low Volume
- A low-volume breakout often traps traders.
- Example: EUR/USD breaking 1.2000 with thin volume failed, and price reversed sharply. Professional traders wait for volume confirmation before entering.
Limitations & Common Mistakes in Volume Analysis

- Ignoring context: not considering trend, timeframe, or news
- Misreading low-volume spikes
- Using volume indicators in illiquid markets
- Over-reliance on volume without price structure
- Trading without stop loss
Volume is a tool, not a crystal ball.
Conclusion
Volume analysis provides insight beyond price, showing market participation, strength, and conviction. It helps traders avoid false breakouts, confirm trends, and identify accumulation or distribution phases. Combined with price action, indicators, and risk management, volume analysis significantly improves trading decision-making across stocks, forex, crypto, and indices

