
Value at Risk (VaR) is known as a statistical tool used to measure and quantify the level of financial risk in a company or an investment portfolio. This article will help you find the answer to the question: What is Value at Risk?
What is value at risk (VaR)?
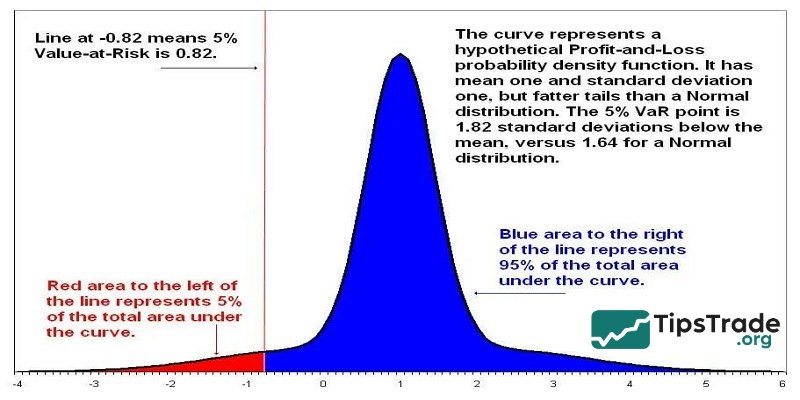
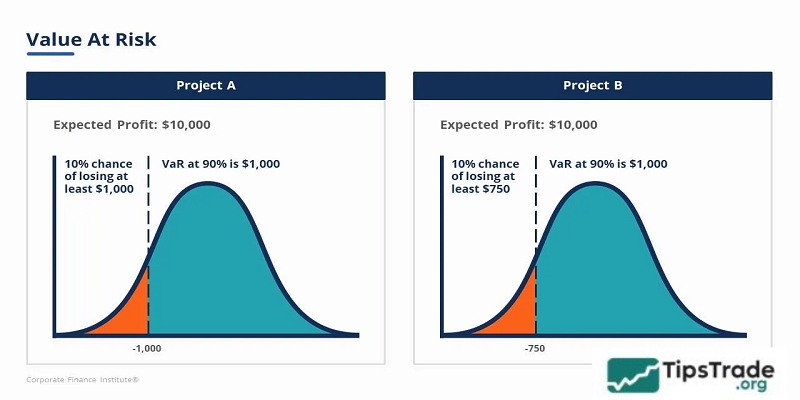
Value at Risk (VaR) is a statistical tool that measures and guides the level of financial risk for a company, an investment portfolio, or holdings over a long period of time.
This metric is commonly used by investment and commercial banks to determine both the magnitude and the probability of potential losses in their portfolios.
Managers prioritize using VaR in the process of measuring and controlling risk levels. In addition, VaR can be applied to calculate risk for an entire investment portfolio or at the company-wide level.
>>See more:
- Factors Affecting the Stock Market
- 1001 Stock Market Terms for Beginners Should Know
- How to Start Stock Investing: A Beginner’s Guide to Building Wealth
- Understanding Stock Investing Risks and How to Manage Them Effectively
Advantages and Disadvantages of value at risk (VaR)
As with all financial analysis there are pros and cons of methodologies. Let’s look at VaR from this perspective:
Advantages of value at risk (VaR)
- Easy to understand: This is a concrete figure that reflects the level of risk in a portfolio. It is measured either in monetary units or as a percentage of the investment.
- Highly applicable: VaR can be applied to all types of assets, such as bonds, stocks, derivatives, etc. Therefore, different financial institutions can use VaR to assess both the profitability and risk of various investments.
- Widely used: VaR is popular and well-recognized, making it a standard tool in the processes of buying, selling, or recommending assets.
Disadvantages of value at risk (VaR)
- Large portfolios: Calculating VaR for a portfolio requires assessing the risk and return of each asset as well as the correlations between them. Therefore, the larger or more diversified the portfolio, the more complex the calculation becomes.
- Differences in methodology: Different methods of determining VaR can lead to different results even for the same portfolio.
- Assumptions: Calculating VaR requires making certain assumptions and using them as input data. If these assumptions are incorrect, the resulting VaR will be inaccurate.
Applications of value at risk (VaR)
Value at Risk (VaR) measures the potential losses and the probability of those losses occurring. Using VaR helps identify the cumulative risk arising from the positions held by an organization. Based on the data provided by the VaR model, organizations can decide whether they have sufficient reserve capital to cover potential losses and, consequently, choose more appropriate investments.
Investment banks often apply VaR to measure risk across the entire organization, as independent transactions can inadvertently expose the institution to assets with high correlation.
Methods of calculating value at risk (VaR)
There are three popular methods for calculating VaR, each with its own advantages and disadvantages depending on the complexity and calculation approach.
Historical method
This is the simplest method to calculate Value at Risk. It assumes that the distribution of past returns is likely to recur in the future. VaR is determined as follows:
- Step 1: Calculate the current value of the investment portfolio.
- Step 2: Compile all past returns of the portfolio according to risk factors (including stock prices, exchange rates, and interest rates).
- Step 3: Rank the returns from lowest to highest.
- Step 4: VaR is calculated based on the confidence level and historical return data using the formula:
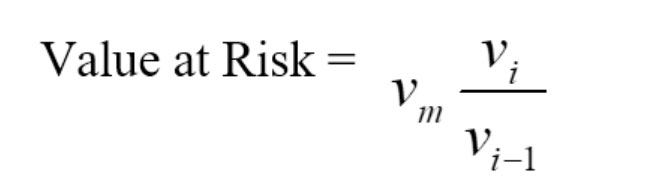
Where: Vi is the number of variables on day i and m is the number of days for which historical data is read.
For example, if you have a dataset of 1,400 past observations and the confidence level is 95%, the VaR value is calculated as: (1-0.95) x1400 = 70.
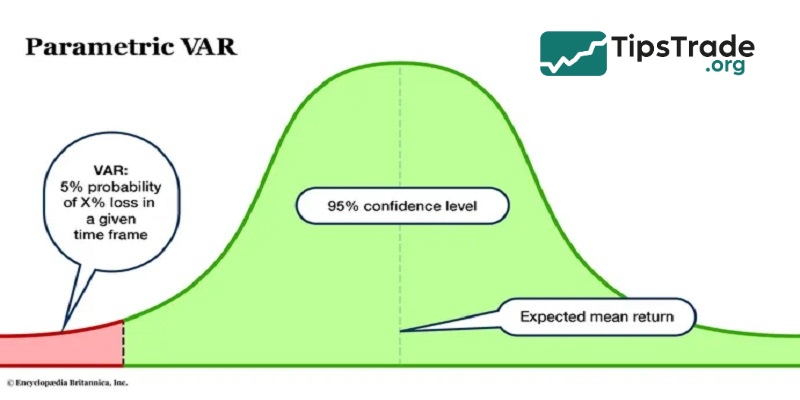
Parametric method
The parametric method is most suitable for risk measurement when the distribution of values is known and the results can be reasonably estimated. If the sample size is very small, this method may not be reliable.
- Step 1: Calculate the current value V0 of the investment portfolio.
- Step 2: Based on historical data, calculate the expected return (m) and the standard deviation of returns (σ) for the portfolio.
- Step 3: VaR is then determined using the formula: VaR = V0×(−m + zqσ)
Example: If the standard deviation σ\sigmaσ is approximately 2.64 and the average return is around 0 (assuming a normal distribution), at a 95% confidence level, the maximum expected loss can be estimated as: 1.65×2.64 = 4.36%
Monte carlo method
This method is suitable for many risk measurement problems, especially when dealing with complex factors.
- Step 1: Simulate a very large number N
- Step 2: Randomly generate a scenario based on a probability distribution of risk factors (stock values, exchange rates, interest rates, etc.) that we think describes historical data. For example, we assume each risk factor is normally distributed with the expected value of the risk factor today. And from a set of recent market data and from the above probability model, we can calculate the volatility of each risk factor and the correlation between the risk factors.
- Step 3: Re-evaluate Vi portfolio in the above market scenario.
- Step 4: Estimate the rate of return (profit/loss) ri = Vi − Vi−1 (portfolio value at step i−1).
- Step 5: Arrange the return ratios ri in order of value from lowest to highest.
- Step 6: Calculate VaR based on the confidence level and percentage of the ri data. For example, if we simulate 5000 scenarios and if the confidence level is 95%, then VaR is the 250th value. If the confidence level is 99%, VaR is the 50th value.
- Step 7: Calculate the corresponding error for each VaR, the higher the number N, the smaller the error.
Value at risk (VaR) example
To calculate Value at Risk (VaR), follow these steps:
|
Confidence |
1 Day Return Percentile |
Value at Risk 100,000 Investment |
|
99% |
-4.44% |
4,439 |
|
95% |
-2.97% |
2,970 |
|
90% |
-2.35% |
2,354 |
- Determine the Confidence Level: choose a confidence level (e.g. 95% or 99%) for the VaR calculation and populate the left-hand column
- Calculate Historical Returns: compute the historical returns for the asset or portfolio
- Organize Returns: list the returns in a table or spreadsheet to analyze the distribution of returns
- Identify the Percentile: identify the return at the chosen confidence level percentile
- Calculate VaR: multiply the identified return by the initial investment to get the VaR in dollar terms
For example: if you have a 1-day VaR of -4.44% at a 99% confidence level for a $100,000 investment, the VaR would be $4,439. This means that there is a 1% chance that the investment may lose $4,439 over the time period.
Conclusion
Hopefully, the knowledge we provide in this article can help you answer the question of what Value at Risk is, which will then assist you in your learning and investment process.
See more: