
The Tweezer candlestick pattern is one of the key patterns commonly used by investors to identify potential price reversals in the market. In this article, Tipstrade.org will provide an in-depth analysis of the Tweezer candlestick pattern, explain how to recognize its key characteristics, and guide you on how to apply it effectively in trading. Let’s explore it together!
What is the Tweezer candlestick pattern?
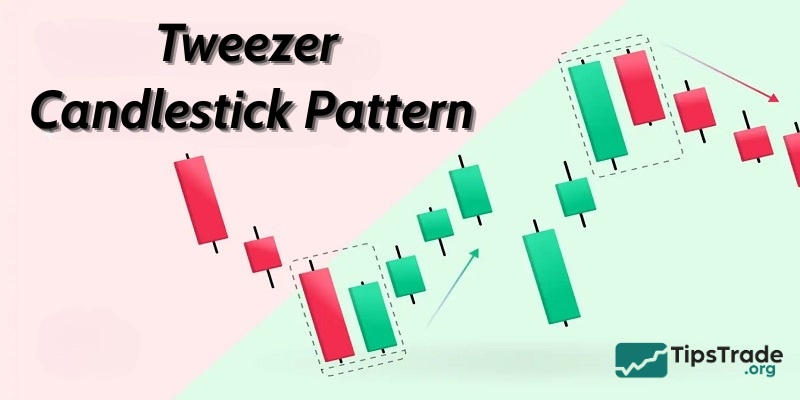
The Tweezer candlestick pattern is a type of short-term reversal pattern in technical analysis, formed by two consecutive candles. The most important characteristic is that the body and/or wicks of the candles have nearly equal lengths, appearing at the end of an ongoing trend.
- When it forms at the end of an uptrend, it is called a Tweezer Top, signaling that prices may reverse to the downside.
- When it appears at the end of a downtrend, it is known as a Tweezer Bottom, indicating a potential upward reversal.
The main significance of this pattern is that the market is gradually losing momentum in its current direction, with a clear tug-of-war between buyers and sellers, thereby creating an early warning sign of a possible trend reversal.
Traders often use the Tweezer candlestick pattern as an early alert that the trend may change in the short term. The price level where the Tweezer pattern appears is usually considered a sensitive zone, with a high likelihood of becoming an important reversal point on the price chart.
See more:
- What is a Bullish Engulfing candlestick and how to trade it?
- Spinning Top Candlestick and How to Apply It in Technical Analysis
- Shooting Star Candlestick Pattern: How to Identify and Trade It Effectively
- Marubozu Candlestick: A Detailed Guide to Identification and Effective Trading
Meaning of the Tweezer candlestick pattern in technical analysis
Reversal signal
- Tweezer Top: Appearing at the end of an uptrend, this pattern signals that buying pressure is weakening and prices are highly likely to reverse downward. It serves as a warning that sellers are gradually gaining control.
- Tweezer Bottom: Forming at the end of a downtrend, it indicates that selling pressure has weakened, buyers are regaining dominance, and prices may reverse upward.
In other words, a Tweezer Top marks the potential end of a bullish cycle, while a Tweezer Bottom signals the conclusion of a bearish cycle.
Practical applications
The Tweezer candlestick pattern offers several practical benefits for investors, especially short-term and trend-following traders:
(i) Identifying appropriate entry/exit points:
- When a Tweezer Bottom appears, investors may consider opening a buy position once additional confirmation signals are present.
- When a Tweezer Top forms, it is a reasonable signal to take profits or reduce long positions to avoid the risk of a sharp price reversal.
(ii) Portfolio risk management:
- When a Tweezer Top emerges, investors can proactively reduce their equity exposure to hedge against the possibility of a significant price decline.
(iii) Optimizing short-term trading performance:
- Thanks to its early reversal warning characteristics, this pattern is well suited for short-term traders to anticipate price movements over the next few sessions, thereby improving overall trading efficiency and profitability.
In summary, the Tweezer candlestick pattern is not merely a technical signal but also a valuable tool that helps investors make timely decisions, capitalize on opportunities, and mitigate risks when the market reverses.
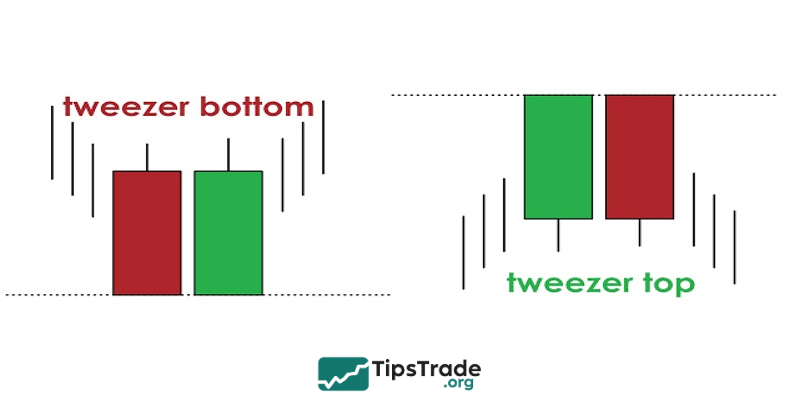
Identification characteristics of the Tweezer candlestick pattern
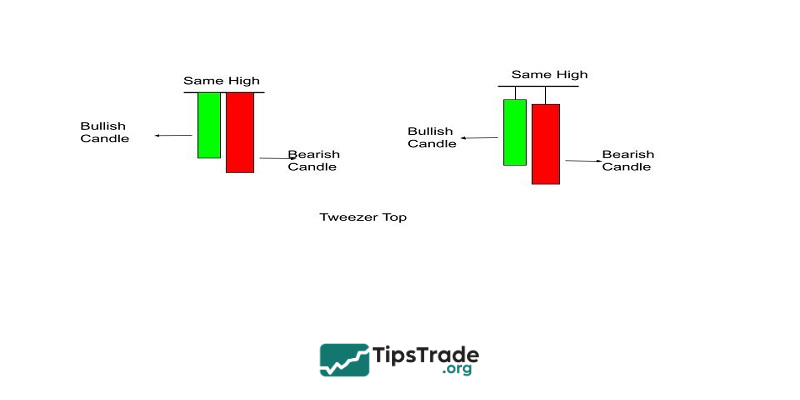
Tweezer Top pattern
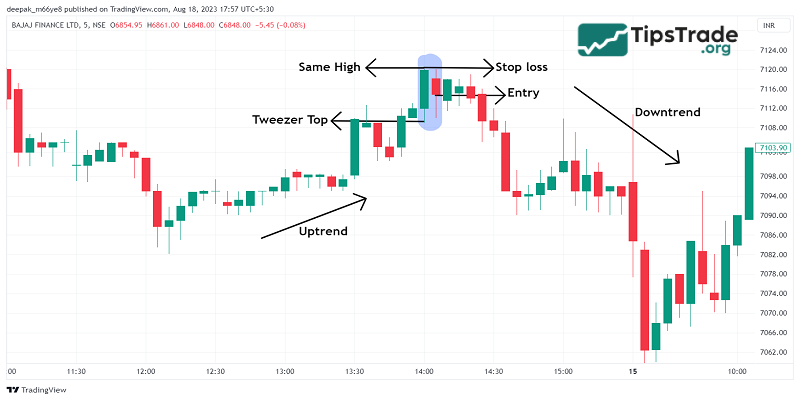
The Tweezer Top pattern typically forms at the end of an uptrend and is regarded as an early warning signal of a potential bearish reversal.
The structure of this pattern consists of two consecutive candlesticks: the first is a bullish candle (often with a long body), indicating that buying pressure remains strong. However, the second candle is bearish, reflecting the return of selling pressure and a shift in market control.
- The highs of the two candles are nearly identical, representing a strong resistance zone.
- The candle bodies are of similar length, showing a balance followed by a transfer of control from buyers to sellers.
- Main implication: after an upward move, the immediate appearance of a bearish candle suggests that the uptrend may be coming to an end, and the market is likely preparing to enter a correction or a downward phase.
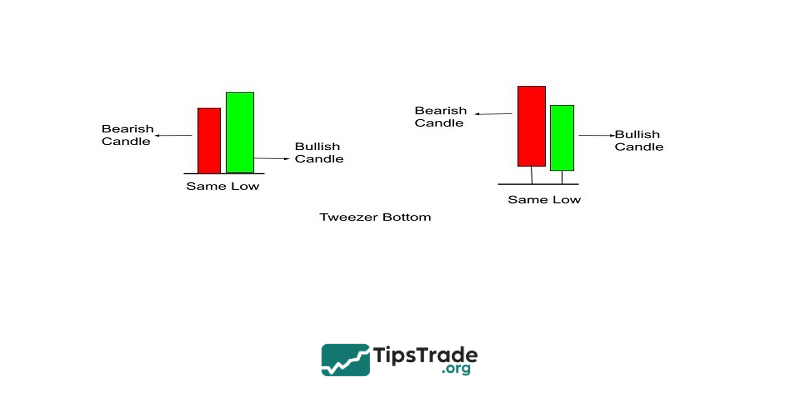
Tweezer Bottom pattern
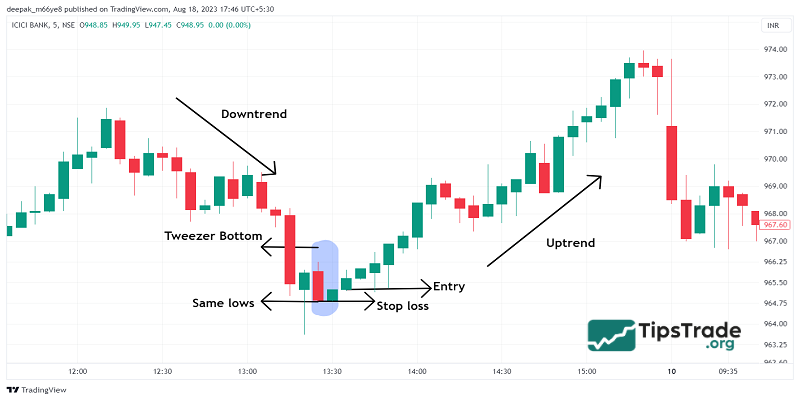
The Tweezer Bottom pattern typically appears at the end of a downtrend, signaling a potential bullish reversal. Its structure consists of two consecutive candlesticks: the first is a bearish candle (often with a long body), indicating that selling pressure remains strong, while the second is a bullish candle, showing that buyers have returned, gained control, and are preparing to push prices higher.
Similar to the Tweezer Top, the candle bodies of the two bars are usually nearly equal in length, and the lowest prices of both candles are almost the same, highlighting an important support zone where sellers repeatedly attempted to push prices lower but failed.
- The lows of the two candles are nearly identical, representing a strong support level.
- The candle bodies are of similar size, reflecting a transfer of control from sellers to buyers.
- Trading volume: often increases significantly on the second candle, reinforcing the reversal signal and indicating that the opposing side has gained dominance, thereby improving the probability of the pattern’s success.
- Main implication: the appearance of a Tweezer Bottom suggests that the downtrend may be coming to an end, and the market is preparing to enter an upward move or a bullish correction.
A visual comparison table of Tweezer Top and Tweezer Bottom for traders to easily understand:
| Feature | Tweezer Top | Tweezer Bottom |
| Position | End of an uptrend | End of a downtrend |
| Candlestick structure | Two consecutive candles: bullish → bearish | Two consecutive candles: bearish → bullish |
| High/Low price | The highs are nearly equal | The lows are nearly equal |
| Candle body | The two candle bodies are of similar length | The two candle bodies are of similar length |
| Trading volume | May increase on the second candle, signaling strong selling pressure | Often increases on the second candle, signaling buyer dominance |
| Meaning | Signals a potential reversal from bullish to bearish | Signals a potential reversal from bearish to bullish |
| Practical application | Taking profits, reducing equity exposure, early reversal warning | Opening buy positions, identifying support levels, early bullish reversal warning |
How to trade effectively with the Tweezer candlestick pattern
Trading with the Tweezer Top
When a Tweezer Top pattern appears at the end of an uptrend, it serves as a warning signal that prices may reverse to the downside. Effective trading steps include:
- Signal confirmation: Wait for the second candle to close, and at the same time check additional indicators such as RSI, MACD, or nearby resistance levels to increase reliability.
- Take profit / exit long positions: If you are holding stocks or long positions, consider selling part of the position or taking partial profits.
- Open short positions: For short-term traders, a short position can be opened once the second candle confirms the reversal, combined with a reasonable stop-loss placed above the high of the Tweezer Top.
- Risk management: Set a stop-loss above the high zone of the pattern to avoid being caught in a “false reversal” if prices continue to move higher.
Trading with the Tweezer Bottom
When a Tweezer Bottom pattern appears at the end of a downtrend, it signals a potential bullish reversal. Effective ways to apply this pattern include:
- Signal confirmation: Wait for the second candle to close and confirm the signal with indicators such as RSI, MACD, or strong support levels to increase the probability of success.
- Open long positions: Enter a buy (long) position at or shortly after the second candle confirms the reversal, with a stop-loss placed below the lowest price of the pattern.
- Increase equity exposure: For long-term investors, this may be a favorable point to increase portfolio allocation and capitalize on the new upward trend.
- Risk management: Maintain proper position sizing and avoid entering too early before full confirmation of the pattern to reduce the risk of further downside if prices continue to fall.
Pros & cons of the Tweezer candlestick pattern
Pros:
- Easy to identify thanks to equal or nearly equal highs/lows.
- Provides early reversal signals at key price levels.
- Can be flexibly applied across multiple timeframes and asset classes .
- More effective when combined with volume and technical indicators.
Cons:
- False signals occur quite frequently
- Does not reflect long-term trends.
- Can be confused with other candlestick patterns.
- Highly dependent on market context (support/resistance).
Notes when trading with the Tweezer candlestick pattern
Key considerations for beginner investors when trading with the Tweezer pattern include:
- It should be combined with support/resistance levels and other technical indicators to improve signal reliability.
- Pay close attention to trading volume; when the second candle shows a strong increase in volume, the reversal signal is usually more reliable.
- The Tweezer pattern is best suited for short-term and trend-following strategies; avoid relying solely on this pattern while ignoring other market factors.
Combining the Tweezer candlestick pattern with other tools
To enhance signal accuracy, the Tweezer candlestick pattern should be used alongside other technical analysis tools, as suggested below:
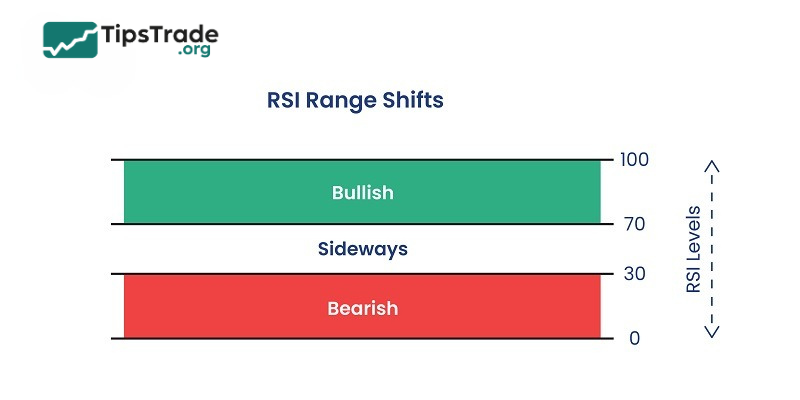
RSI (Relative Strength Index)
- A Tweezer Top accompanied by RSI in the overbought zone (≥70) provides a stronger bearish reversal signal.
- A Tweezer Bottom with RSI in the oversold zone (≤30) strengthens the likelihood of a bullish reversal.
MACD (Moving Average Convergence Divergence)
- A Tweezer Top appearing when the MACD crosses below the signal line confirms a bearish trend.
- A Tweezer Bottom forming when the MACD crosses above the signal line increases confidence in a bullish reversal.
Moving Averages (MA)
- A Tweezer Top forming near the MA200 or MA50 warns that the uptrend may be coming to an end.
- A Tweezer Bottom appearing at a key MA support level provides a stronger bullish reversal signal.
Combining the Tweezer pattern with oscillators (RSI), trend indicators (MACD, MA), and trading volume helps reduce market noise and significantly increases the probability of successful trades.
Real-world examples of the Tweezer candlestick pattern
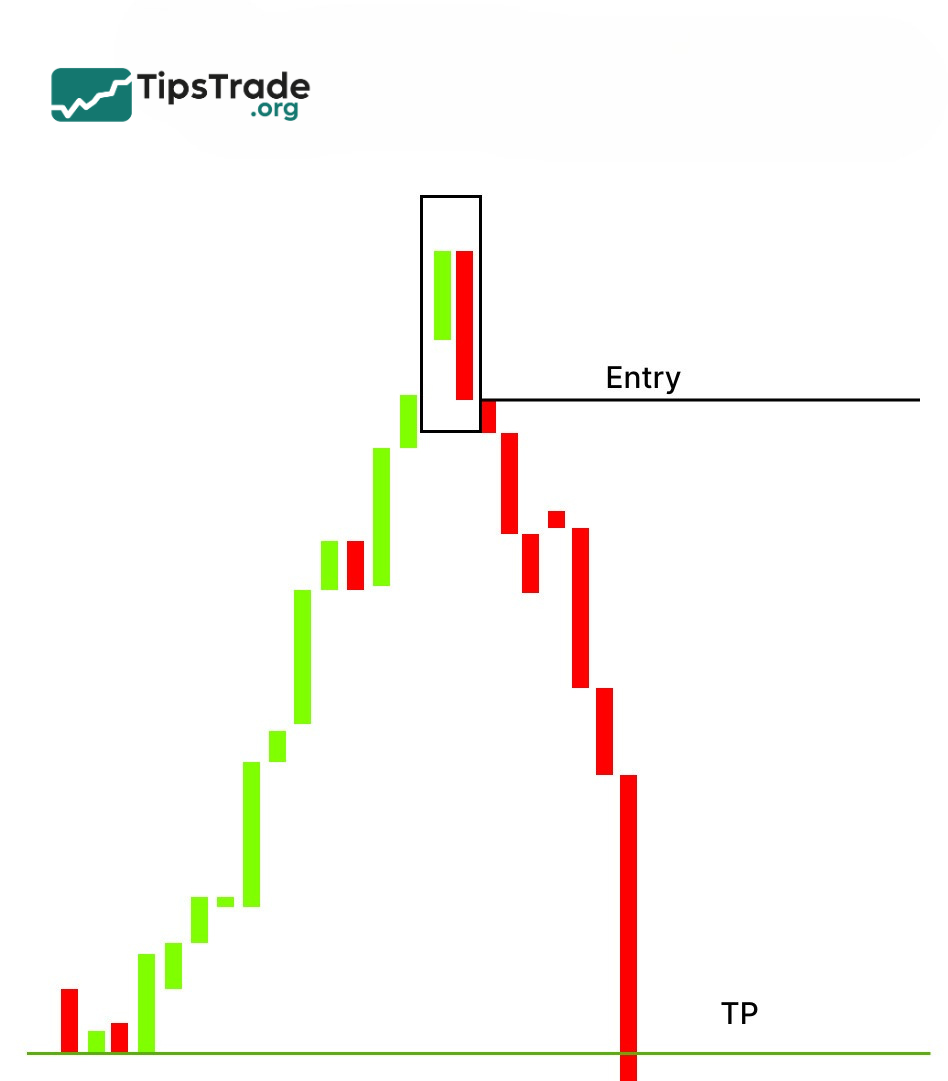
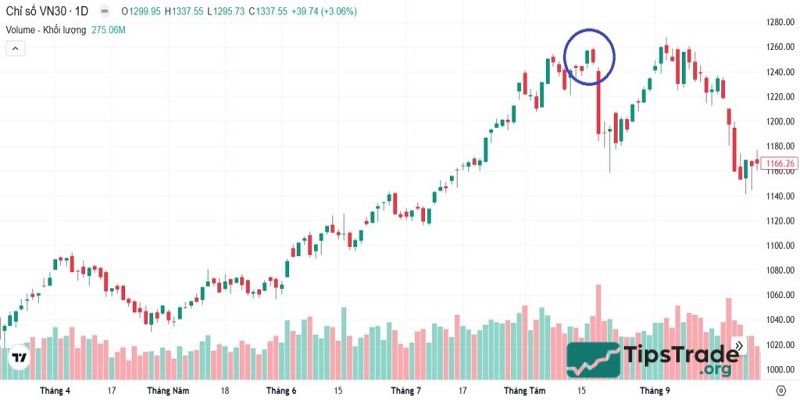
- Example 1: Tweezer Top in an uptrend
The chart above shows an example of a Tweezer Top candlestick pattern. After a strong upward move, the VN30 index formed this pattern and then quickly experienced a sharp decline. You can observe that the trading volume of the second candle is slightly higher than that of the first candle, reinforcing the bearish reversal signal.
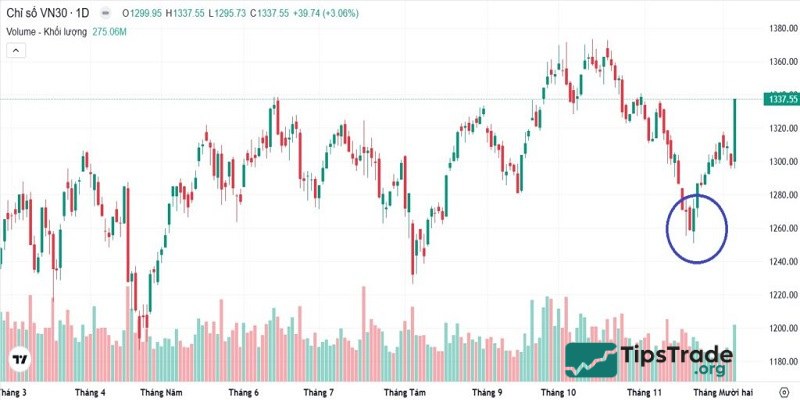
- Example 2: Tweezer Bottom in a downtrend
The image above is an example of the Tweezer Bottom pattern of the VN30 index. After a strong price decline, the VN30 also formed a Tweezer Bottom pattern and subsequently reversed to establish a new uptrend.
You can also see that the volume of the second candle is higher than that of the first candle. Additionally, the VN30 has dropped to the support zone, which increases the likelihood of the pattern’s success.
Conclusion
The Tweezer candlestick pattern is a powerful chart analysis tool in the arsenal of investors. By effectively utilizing this pattern, you can enhance your trend forecasting ability and improve your trading performance. We hope that through this article, you have gained a deep and specific insight into the Tweezer candlestick pattern to apply it effectively in your investments.
See more: