
TradingView heatmap stocks are a powerful visual tool that helps traders quickly understand market trends, identify top-performing stocks, and spot potential opportunities at a glance. So, what are the TradingView heatmap stocks? How to use it for analyzing stock trading effectively? In the article below, Tipstrade.org will detail the answer.
What are the TradingView heatmap stocks?
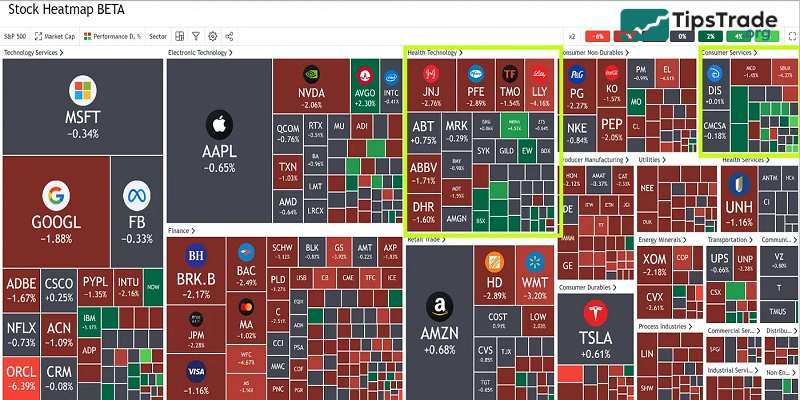
The TradingView heatmap stocks are a visual tool used by traders to monitor multiple stocks at the same time. Accordingly, it uses color coding to represent changes in stock value, making it easy to identify trends and anomalies. This heatmap updates in real time, displaying stock performance throughout the trading day.
See more:
- What is TradingView? A Platform Providing Visual Charts for Traders
- Top Powerful TradingView Features Every Trader Should Know
- TradingView for Crypto Traders: On-Chain Analysis and Charts
- TradingView Stocks: A Guide to Analysis and Identifying Precise Entry Points
Top features of the TradingView heatmap stocks
Top features of the TradingView heatmap stocks will be presented in detail in the content below:
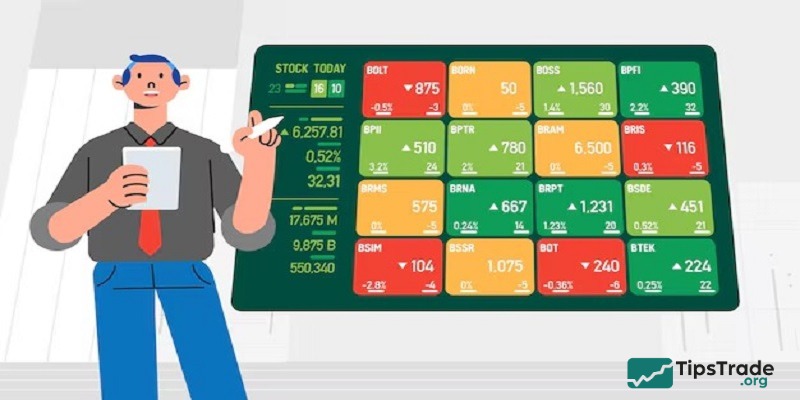
- Market overview: Quickly assess the overall market conditions. A green-to-red gradient shows which sectors or stocks are performing well and which are not.
- Volatility detection: Identify stocks with high volatility. Colors intensify as price fluctuations increase, helping traders spot potential opportunities or risks.
- Comparative analysis: Compare the performance of stocks within the same sector or across different ones. This helps in making informed decisions based on sector strength.
- Historical data review: Track how stocks have performed over time. Adjust the timeline to see past performance trends and how they correlate with current data.
- Investment strategy development: Develop and refine investment strategies based on visible trends and anomalies spotted within the heatmap.
At its core, the TradingView heatmap stocks are an essential tool for traders who need to make fast, data-driven decisions. With features such as market movement tracking and historical data comparison, it provides valuable insights in line with the platform’s terms of use, helping users optimize their trading strategies effectively.
How to interpret the TradingView heatmap stocks
Traders can quickly and visually analyze market conditions once they understand how to interpret the TradingView heatmap stocks. As mentioned in the definition above, this tool displays stocks in varying colors and sizes, indicating their performance and relevance within the market. Here’s how you can do it via different factors:
Color indications
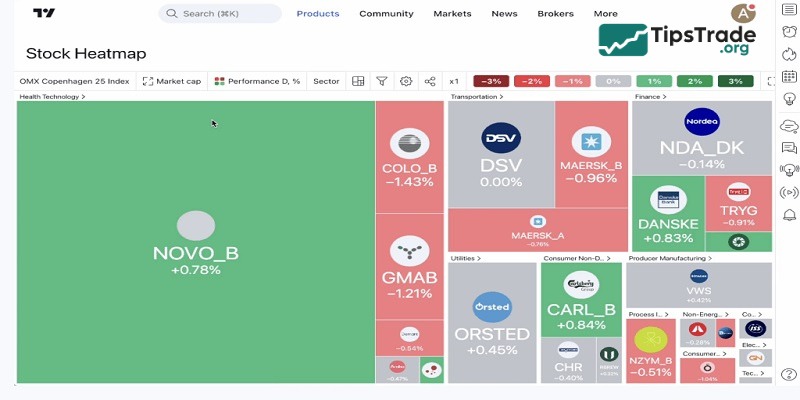
One of the most prominent features of the TradingView heatmap stocks is its use of color to represent stock performance. Typically, shades of green indicate growth or positive price changes, while shades of red represent declines. The intensity of the color varies depending on the magnitude of the stock’s performance. This instant visual signal helps traders quickly identify which stocks are outperforming or underperforming at any given time.
Example: If Apple Inc. (AAPL) appears as a bright green tile with a +1.09% gain, it indicates positive performance during that trading session. Conversely, a dark red tile with a -1.92% change shows that the stock price is declining. The color intensity reflects the magnitude of the price movement.
Block size and market cap
The size of each block on the TradingView heatmap stocks is related to the company’s market capitalization. Larger blocks represent companies with higher market caps, making it easy to identify the market “giants.” This feature is crucial because price movements in these stocks can significantly impact the entire sector they represent.
For example: A giant block for Microsoft might indicate a market cap of approximately $1.5 trillion. In contrast, a smaller block for a company like Dropbox might represent a smaller market cap. This size differentiation helps traders quickly identify market leaders and assess their impact on the market.
Sector grouping
The TradingView heatmap stocks provide an overview of stocks grouped by sectors or industries. This grouping method helps traders quickly assess the overall health of specific sectors. If most blocks within a sector appear red, it may indicate a sector-wide decline; conversely, a dominance of green suggests that the sector is growing or strongly recovering.
Dividend yield
Dividend yield is a crucial metric for investors focused on passive income. The TradingView heatmap stocks can be configured to highlight companies with higher dividend yields through larger blocks. This setup is beneficial for quickly identifying income-generating stocks.
On the heatmap, a stock like AT&T might appear with a larger block if set to reflect dividend yields, given its high yield of around 7%. This visualization helps investors quickly spot high-yield opportunities.
Price to earnings ratio (P/E)
The P/E ratio is an important metric that investors use to evaluate a stock’s value relative to its earnings. On the TradingView heatmap stocks, you can adjust the settings to display the P/E ratio, allowing you to quickly see which stocks may be overvalued (high P/E) and which may be undervalued (low P/E).
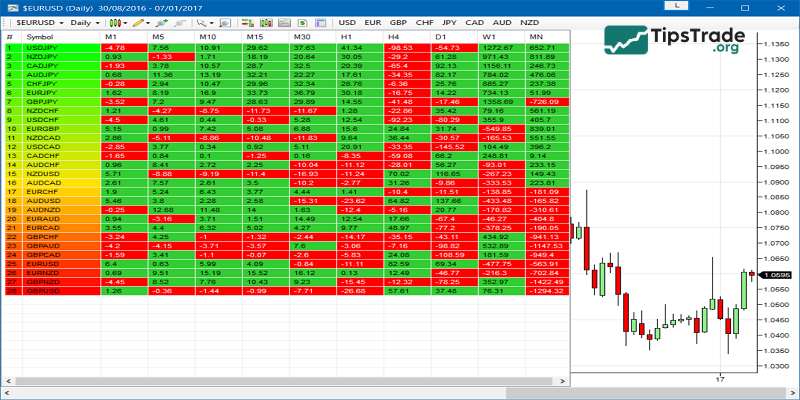
Volume and price volatility
Trading volume indicates the number of shares being bought and sold and can signal a stock’s stability or volatility. High trading volume is often associated with significant price fluctuations – something that is especially important for day traders. The TradingView heatmap stocks can be customized to display volume data, helping you identify which stocks are the most actively traded.
Custom filters
The TradingView heatmap stocks offer customizable filters to focus on specific criteria such as price changes, trading volume, or the P/E ratio. By using these filters, you can design a heatmap that displays only the information relevant to your trading strategy, helping you focus on stocks that meet your investment criteria.
How to use the TradingView heatmap stocks
Let’s explore the process of accessing and customizing this TradingView heatmap stocks:
- Log in to TradingView: Users should start by logging into their TradingView account. A registered account is required to access all features. After logging in, you can proceed to explore the heatmap section to analyze the market.
- Navigate to the heatmap section: Next, users need to locate the heatmap feature in the main menu. You can access it through the “Markets” tab. Click on it to open the heatmap and visualize market performance.
- Select the market: Users can choose the market they want to analyze. Options include various asset classes, sectors, or regions, allowing you to customize the display based on the specific markets you are interested in.
- Customize filters: Users can adjust filters to narrow their focus. Filters include sorting by sector, region, or asset type. Customizing filters helps refine the heatmap and ensures it aligns with the user’s analysis needs.
- Analyze the heatmap: Once the heatmap loads, users can review key trends. Color coding highlights price movements: green indicates gains, while red indicates losses. This provides an easy-to-understand overview of market sentiment.
- Click on an asset for detailed view: Users can click on any asset within the heatmap to open a detailed chart for deeper analysis. You can view specific performance data to make more informed decisions.
- Adjust settings as needed: Settings can be modified to further refine the analysis. Users can change the time frame, filters, or display options. These adjustments ensure the heatmap reflects the user’s trading strategy and preferences.
- Monitor in real time: The heatmap updates in real time, providing live market data. Users should monitor changes as they occur. Real-time updates allow timely responses to shifting market conditions.
- Make informed decisions: With insights gained from the heatmap, users can make informed trading decisions. Market trends and performance data guide their actions, helping them make strategic and timely choices in the market.
Benefits and risks of using the TradingView heatmap stocks
Benefits of using the TradingView heatmap stocks
- Visual representation: Heatmaps provide a clear visual overview of market data. Color coding makes trends and price movements easy to spot quickly
- Real-time data: Heatmaps offer real-time updates on asset performance. Traders can access live data for more accurate, timely decision-making
- Easy identification of trends: Traders can quickly identify market trends. The color-coded format highlights significant price movements and helps spot strong trends
- Helps track sector-wide trends: Heatmaps can focus on entire sectors. Traders can track the performance of specific industries or asset groups with one look.

Risks of using the TradingView heatmap stocks
- Can be overwhelming: A heatmap with many assets can feel cluttered. Too much information may overwhelm traders, especially beginners
- Limited depth: Heatmaps provide a high-level overview. They lack the depth and detail of individual asset analysis, limiting comprehensive insights
- Potential for misinterpretation: Colors may be misinterpreted, especially if traders overlook finer details, leading to incorrect conclusions or decisions
- Dependence on color perception: Heatmaps rely on color coding, which may be challenging for those with color vision impairments. This could affect their usefulness for some traders
How to optimize the TradingView heatmap stocks for effective trading analysis
Using the TradingView heatmap stocks simplifies the analysis of stock trading. Real-time updates, color coding, and customizable filters help traders quickly identify trends. This tool allows them to monitor live market movements and adjust settings accordingly. However, traders should avoid information overload and ensure they interpret the data accurately to make effective trading decisions.
Conclusion
In summary, mastering TradingView heatmap stocks can significantly improve your market analysis by providing real-time insights, visual trend identification, and customizable filters for deeper evaluation. When used correctly, this tool can help traders detect market momentum, compare sectors, and refine their trading strategies. By following this step-by-step guide, you can leverage TradingView heatmap stocks to make smarter, data-driven trading decisions and stay ahead in the financial markets.
See more: