
TradingView for crypto has become an essential tool for cryptocurrency traders thanks to its powerful charting features and advanced on-chain analysis capabilities. With an intuitive interface, thousands of technical indicators, and multi-market tracking, TradingView helps traders make more accurate decisions in the highly volatile crypto market. In this article, we will explore how TradingView supports on-chain analysis and charts to optimize your crypto trading strategies.
What is TradingView for crypto?
TradingView for crypto is a company that provides an online service and social network for traders. The core platform of TradingView is an advanced technical analysis tool, along with a social network where traders actively share insights and continuously update each other on cryptocurrency market movements.
TradingView offers a wide range of professional analytical tools and charts such as Supply and Demand, Elliott Waves, Harmonic Patterns, and various chart patterns. These tools are designed to be highly intuitive and user-friendly, effectively supporting traders in their trading activities and market monitoring.
In addition, TradingView allows users to analyze markets across multiple timeframes, from the smallest intervals to longer-term frames such as 3 months, 6 months, and 1 year. This feature is particularly useful for long-term cryptocurrency investment analysis.
Recently, TradingView raised 298 million USD in a funding round led by Tiger Global Management, according to Bloomberg.
>>See more:
- How to Use TradingView Mobile App for Beginners
- Top Powerful TradingView Features Every Trader Should Know
- TradingView Stocks: A Guide to Analysis and Identifying Precise Entry Points
- How to draw trendline TradingView to analyze market trends in 5 minutes!
Key advantages of TradingView for crypto traders
The popularity of TradingView is no coincidence. This platform offers a wide range of outstanding benefits:
- Supports multiple languages worldwide.
- Has a large community, where information is continuously updated and highly accurate.
- An independent trading platform, not tied to any specific operating system.
- Allows multi-timeframe chart analysis with multiple currency pairs simultaneously.
- Cross-market analysis: TradingView supports multiple markets beyond cryptocurrencies, such as forex, oil, stocks, and more.
- Intuitive charting tools with many parameters and customization options, with candlestick charts being the most commonly used.
- A convenient place to store and review trading history.
TradingView subscription plans for cryptocurrency trading
TradingView for crypto offers four different subscription levels:
Basic (Free)
- 1 chart per tab
- 1 device at the same time
- 1 saved chart layout
- Day, week month bar replay
- 12 customizable chart types
- 50+ smart drawing tools
- Compare symbols
- 100+ pre-built indicators, 8,000 community-powered indicators
- 3 indicators per chart
- 1 server-side alert on price, indicators, or drawings
- Advertisement-supported
- No customer support
Pro ($12.95 Per Month Paid Annually / $14.95 Per Month Paid Monthly)
- 2 charts per tab
- 1 device at the same time
- 5 saved chart layouts
- Custom time intervals and range bars
- 12 customizable chart types
- 50+ smart drawing tools
- Compare symbols
- 100+ pre-built indicators, 8,000 community-powered indicators
- 5 indicators per chart
- 10 server-side alerts on price, indicators, or drawings
- No advertisements
- Regular customer support
Pro+ ($24.95 Per Month Paid Annually / $29.95 Per Month Paid Monthly)
- 4 charts per tab
- 2 devices at the same time
- 10 saved chart layouts
- Custom time intervals and range bars
- Intraday charts based on custom formulas (spreads)
- Intraday Renko, Kagi, Line Break, Point & Figure charts
- 12 customizable chart types
- 50+ smart drawing tools
- Compare symbols
- 100+ pre-built indicators, 8,000 community-powered indicators
- 10 indicators per chart
- 30 server-side alerts on price, indicators, or drawings
- No advertisements
- Priority customer support
Premium ($49.95 Per Month Paid Annually / $59.95 Per Month Paid Monthly)
- 8 charts per tab
- 5 devices at the same time
- Unlimited saved chart layouts
- Custom time intervals and range bars
- Second-based intervals
- Intraday charts based on custom formulas (spreads)
- intraday Renko, Kagi, Line Break, Point & Figure charts
- 12 customizable chart types
- 50+ smart drawing tools
- Compare symbols
- 100+ pre-built indicators, 8,000 community-powered indicators
- 25 indicators per chart
- 200 server-side alerts on price, indicators, or drawings
- No advertisements
- First priority customer support
- 30 day free trials are available for all plans.
Guide to registering a TradingView account for crypto
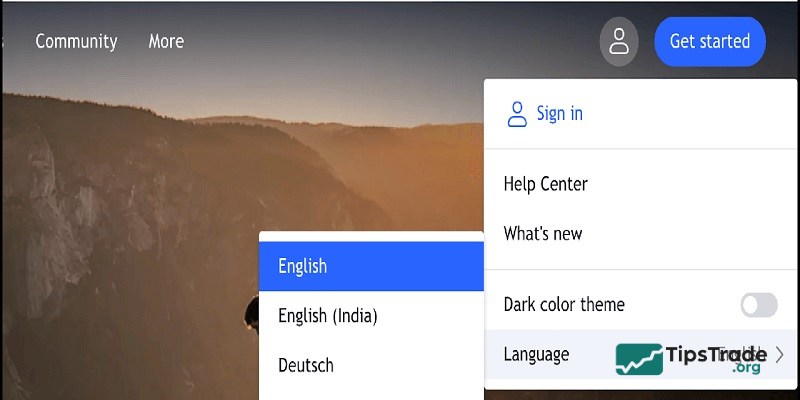
Step 1: First, visit https://www.tradingview.com/, then click the profile icon in the top-right corner and select Language to choose your preferred language, such as English or Vietnamese,…
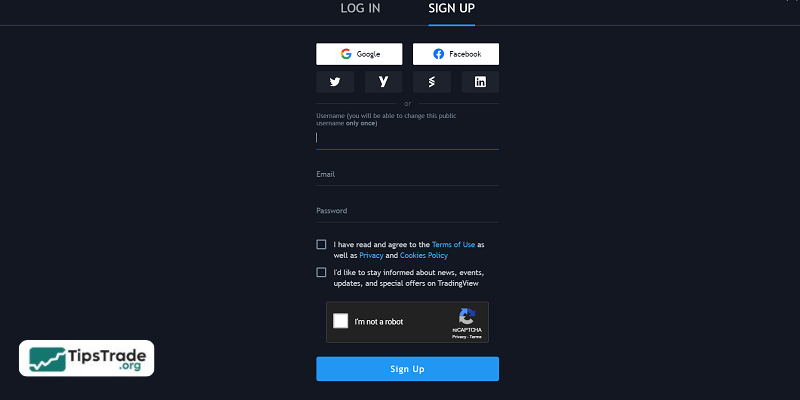
Step 2: Click “Get Started” and then select “Sign Up.” You will be redirected to the account registration page (free account).

Step 3: You have two ways to create a new account: sign up with Email, or log in using accounts such as Google, Facebook, Twitter, Yahoo, Apple, or LinkedIn. For better security, it is recommended to use Email. Enter the following information:
- Username: Your account name (without accents or spaces)
- Email: Enter your email address
- Password: Your password
- Check “I have read and agree to…”
- Check “I’m not a robot”
- Finally, click “Create Account” to complete the registration.
Step 4: TradingView will send a verification email to your inbox. Open the email and click the verification link to activate your account and start using TradingView.
Upgrading to a TradingView Pro Account
By default, you can use a free TradingView account with basic tools and features.
If you need more advanced capabilities, you can subscribe to TradingView PRO, PRO+, or PREMIUM plans, which offer many premium features. Notably, you can enjoy a 30-day free trial for any plan you choose.
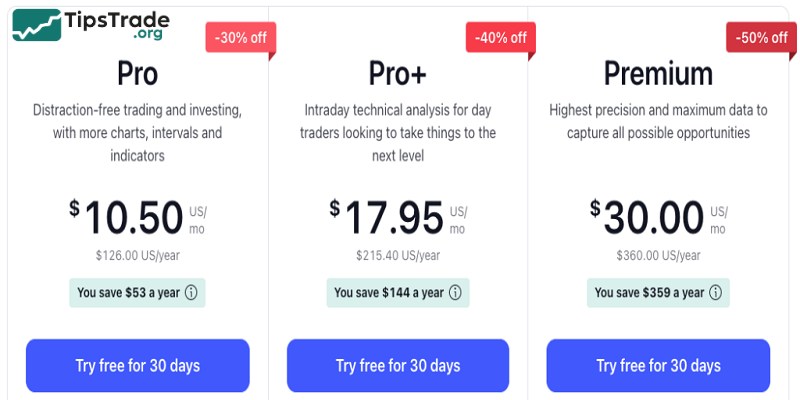
The monthly prices for TradingView plans are $14.95 for PRO, $29.95 for PRO+, and $59.95 for PREMIUM. If you choose annual billing, you can receive significant discounts, with the exact price depending on TradingView’s promotional periods.
How to use TradingView for crypto to track BTC, ETH, and altcoins
Overview of the TradingView interface
The TradingView interface consists of three main sections:
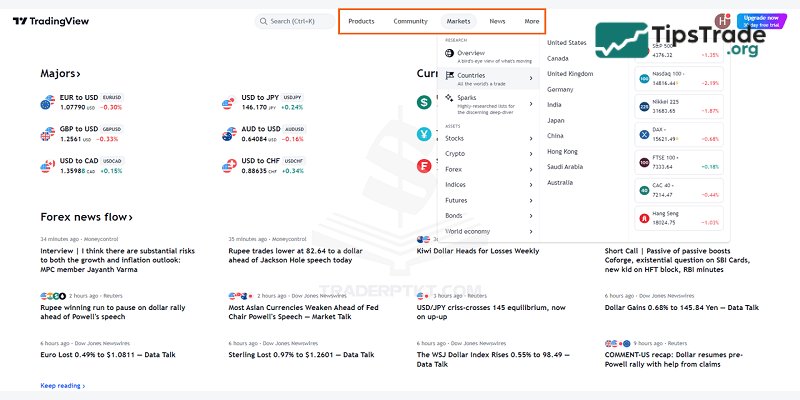
- Menu bar: Located at the top of the screen, including Search, Charts, News, Screeners, Community, and More.
- Main content area: The central section of the screen, which displays market overviews, insights, and articles from well-known trader authors.
- Toolbar (Right sidebar): A tool panel on the right side of the screen that is always visible, allowing you to track the most important information. From the Toolbar, you can quickly switch between tools such as Watchlist, Alerts, Calendar, Ideas, and Chat.
How to find coins, coin pairs, and track them on TradingView
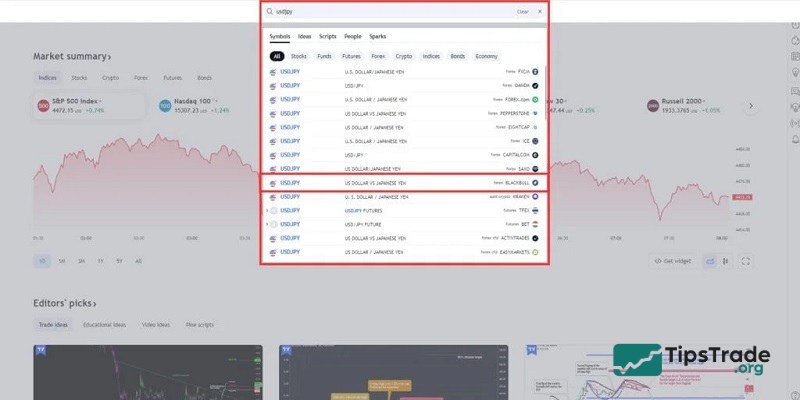
There are two ways to find the coins and trading pairs you want to track on TradingView:
- Method 1: Search directly in the platform’s search bar by entering the coin name or trading pair you want to follow.
- Method 2: Search for the coin or trading pair in the Toolbar (tool panel) on the platform.
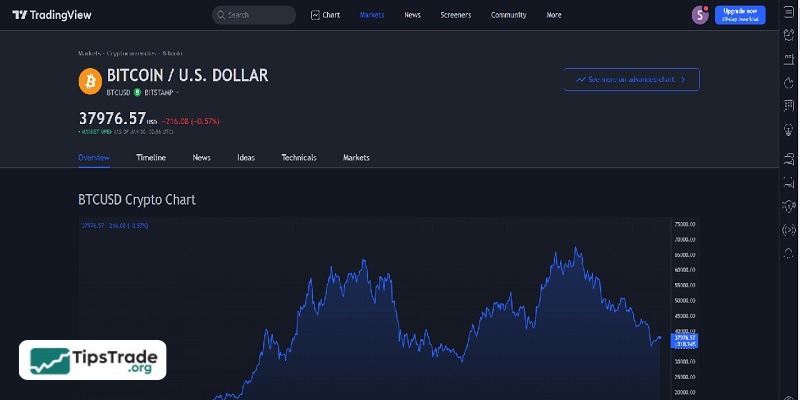
When you click on a coin in your watchlist, the main panel will display detailed information about that coin, including price history, market volume, charts, and related news.
If you want to view more detailed information, click “Launch full chart view.” This will open a detailed chart interface for the trading pair you are interested in.
Sections on the TradingView for crypto chart
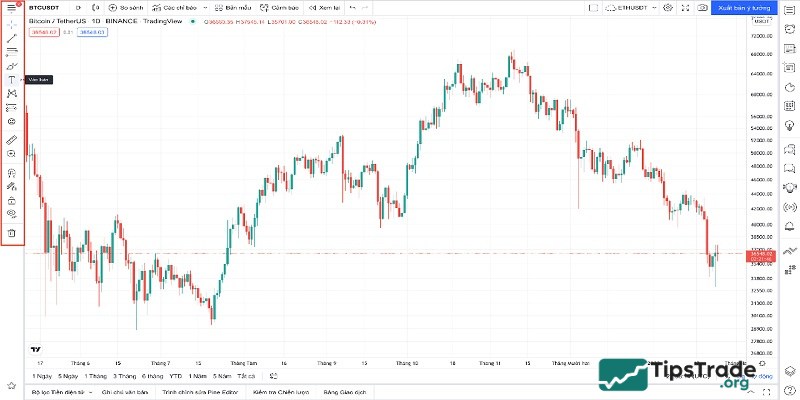
Part 1: Left Toolbar
In this area, you need to manually draw and measure tools on the chart. Therefore, you must understand the meaning of each tool or learn technical analysis to fully utilize all the tools provided by TradingView.
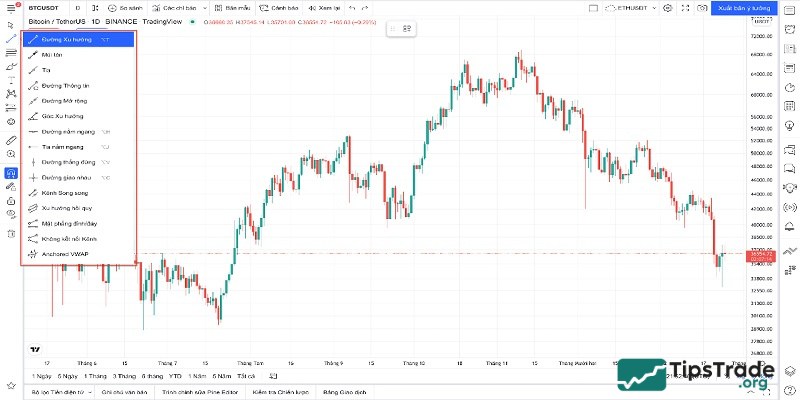
When you click on “Trend Line” as shown below, a small tool window will appear containing various drawing tools to help you identify price trends, determine support and resistance levels, and draw price channels.
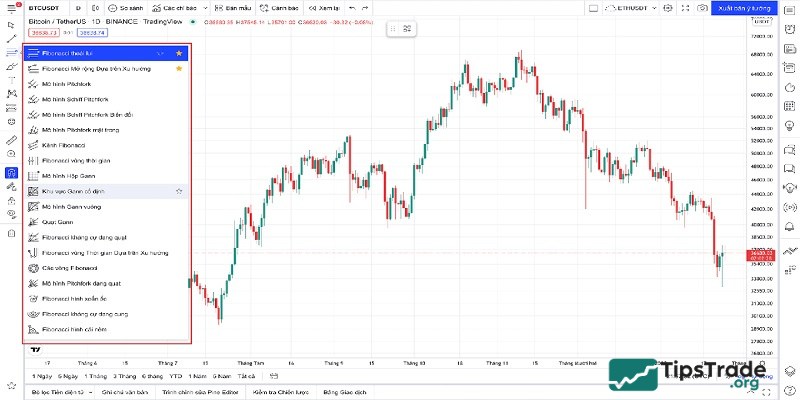
When you click on “Fibonacci Retracement” as shown below, another tool window will appear with all Fibonacci tools and Gann tools, allowing you to draw them on the chart to identify suitable buying and selling points.
Part 2: Top Toolbar
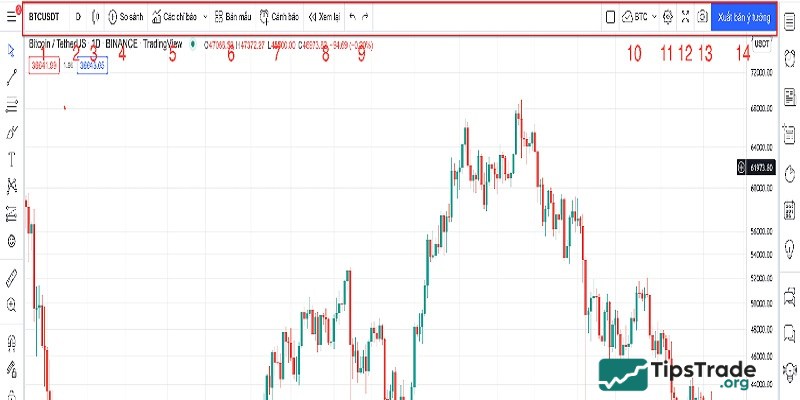
- Trading Pair Name: Allows you to select and switch between different trading pairs.
- Timeframes: Contains all timeframes provided by TradingView. TradingView divides timeframes into five categories: Seconds, Minutes, Hours, Days, and Ranges. With a paid plan, you can also create custom timeframes.
- Chart Types: You can choose from various chart types such as Japanese Candlesticks, Heikin-Ashi, Renko, and more.
- Compare or Add Symbol: Allows you to compare the current chart with other charts to better understand correlations between different trading pairs.
- Indicators / Indicators & Strategies: You can add many indicators such as Bollinger Bands, Moving Averages, RSI, MACD, Ichimoku, etc. To add an indicator, simply click the indicator icon and select the one you want.
- Templates: Pre-built templates integrated by TradingView. You can also create your own indicators or templates and save them for later use without needing to set them up again.
- Create Alert: A very useful feature provided by TradingView. You can set alerts at your desired price level (for example, BTC at $30,000). When the price reaches that level, a popup notification will appear, and you can also choose to receive alerts via email or SMS.
- Replay: Opens the replay bar to review past market movements and your previous analysis.
- Undo and Redo Icons: Allow you to go back or forward to restore previous changes.
- Save Chart: Saves all your chart analysis and settings.
- Chart Settings: Customize chart settings such as candle colors, borders, and time zones.
- Full Screen Mode: For viewing the chart in full-screen mode.
- Instant Snapshot: Captures the chart and generates a shareable image link quickly.
- Publish Idea: Share your trading ideas and analysis with the TradingView community.
Part 3: Main Chart Area
This is the area where charts are displayed. You can draw and add any indicators here. To access more features in this section, you need to right-click on the chart as shown below:
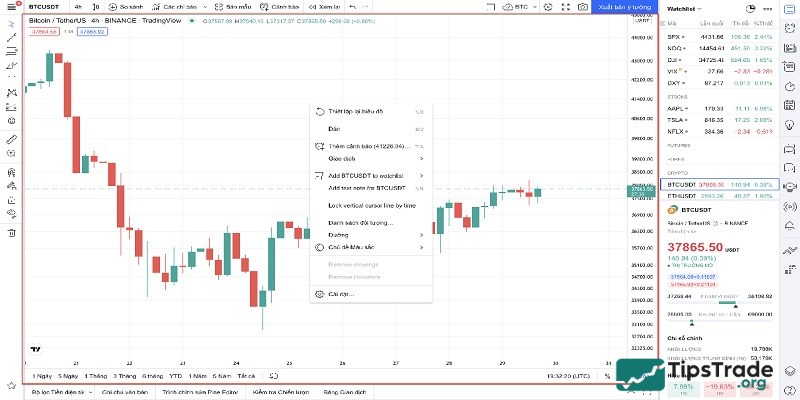
- Reset Chart: A feature that allows you to return the chart to its default state without needing to manually adjust it.
- Add Alert: Allows you to set a price level for alerts, choose an expiration date, and select how you want to receive notifications.
- Trading: Lets you practice trading using a demo account.
- Add Chart to Watchlist: This feature allows you to add a trading pair to your watchlist.
- Add Note: Allows you to add personal notes and share the chart with others.
- Lock Vertical Line on Time Axis: This feature is used to mark a specific time point on a candlestick. When you switch timeframes, you can easily find that candlestick again.
- Object Tree: A list of all tools and objects you have added to that trading pair.
- Theme Color: You can choose between light or dark mode for the background.
- Chart Settings: Contains customization options to personalize your chart.
Part 4: Right Sidebar Toolbar
This is one of the most frequently used sections in TradingView, consisting of two main parts: the watchlist of trading pairs and the connection panel for interacting with other traders.
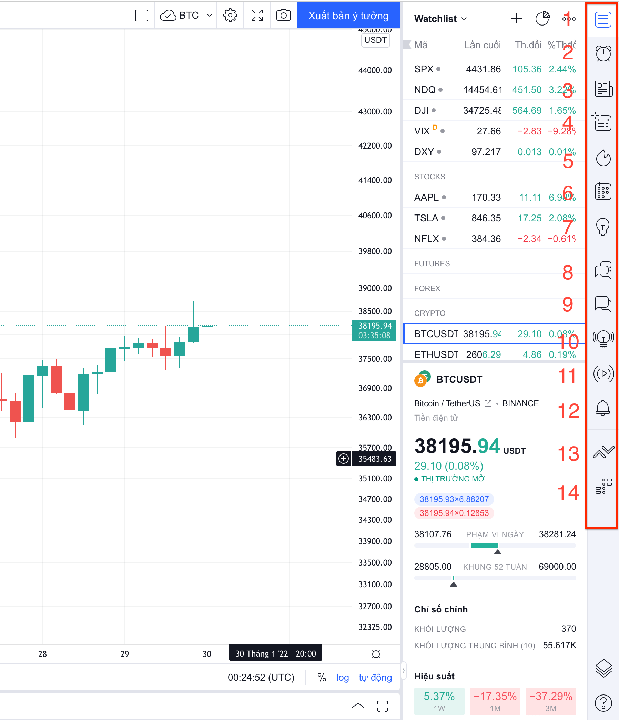
- Watchlist: Contains all trading pairs and assets you can analyze or monitor.
- Alerts: Where you can create alerts for the trading pairs you want to track.
- News: Provides quick access to the latest market news.
- Data Window: Displays detailed information such as open price, close price, high, and low.
- Hotlist: Shows the top 10 stocks based on three criteria: volume gainers, percentage gainers, and percentage losers, with real-time data updates.
- Calendar: Allows you to view upcoming economic or market events.
- My Ideas: A place to save your personal trading ideas. You can keep them private or share them with other users.
- Public Chat: Connects you with other traders on the TradingView social network.
- Private Chat: Lets you send private messages to any TradingView user.
- Ideas Stream: Displays trading ideas suggested by TradingView. All notifications related to your account will also appear in this section.
- Broadcast: A new feature currently in the testing phase.
- Notifications: Where you receive alerts and system notifications from TradingView.
- Trading Panel: Allows you to connect directly to supported exchanges and brokers integrated with TradingView.
- DOM (Depth of Market): Shows all Bid/Ask price levels. In the DOM panel, you can place pending orders or execute market orders directly.
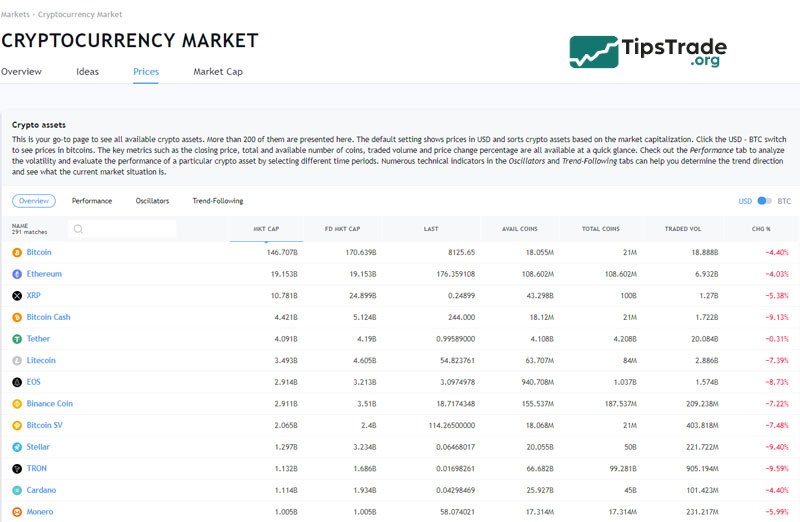
How to filter Buy/Sell signals across the crypto market on TradingView
Step 1: Get Started
- First, visit the link: https://vn.tradingview.com/cryptocurrency-signals/
- Or, on TradingView, go to Screener > Crypto Screener. This is a powerful tool for anyone looking for trading signals for coins they plan to invest in.
The tool displays a list of coins that are rated “Buy” or “Strong Buy.” It also provides filters such as CHG (Change), Volume, Rating, Close Price, Exchange, and more, allowing you to quickly assess the market.
You can also perform quick analysis using built-in scoring tools like Pivot Classic, Fibonacci, and Camarilla.
Step 2: Next, choose the candlestick timeframe you want to analyze. There are five preset options: 15 minutes, 1 hour, 1 day, 1 week, and 1 month.
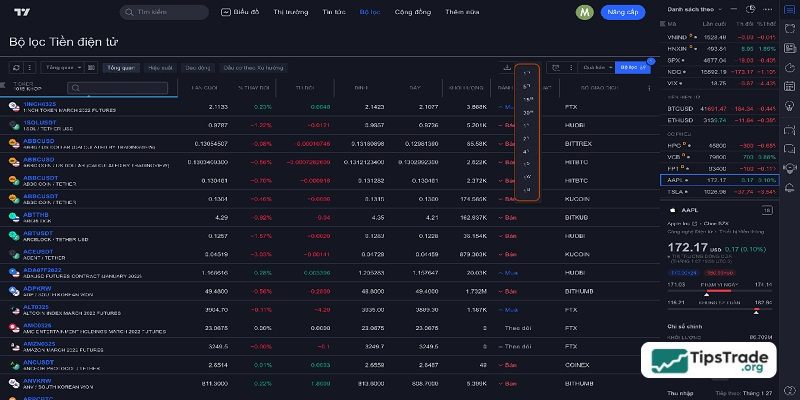
Step 3: Then, select the exchange you want to filter signals from. TradingView provides many preset filters for you to choose from. One of the most commonly used filters is Oversold, which helps identify potentially undervalued coins.
Why should you use TradingView to trade crypto?
TradingView is currently one of the most popular technical analysis platforms, widely used by professional traders. Even major exchanges such as Binance, Huobi, BitMEX, KuCoin, and Cryptopia integrate TradingView charts to provide a more convenient trading experience for their users.
If you are still wondering whether you should switch to TradingView, consider the following reasons:
- Multi-source price analysis: TradingView allows you to retrieve market data from multiple exchanges.
- Powerful social network: With TradingView’s large community, you can easily learn trading strategies and analytical skills from professional and experienced traders.
- Multi-timeframe analysis: TradingView makes it simple and convenient to analyze multiple timeframes for the same trading pair simultaneously.
Conclusion
This is the article “TradingView for Crypto Traders: On-Chain Analysis and Charts” from Tipstrade.org. We hope that this guide helps you understand and effectively use TradingView’s key features to trade cryptocurrencies more efficiently and achieve better results.