
TradingView for beginners is an essential topic for anyone starting their trading journey and looking for a powerful charting and analysis platform. With its intuitive interface, advanced technical tools, and a large trading community, TradingView helps beginners understand market trends, analyze price movements, and make informed trading decisions. In this article, you will learn how to use TradingView effectively, from setting up your account to mastering key features and tools.
Quick overview of TradingView for beginners
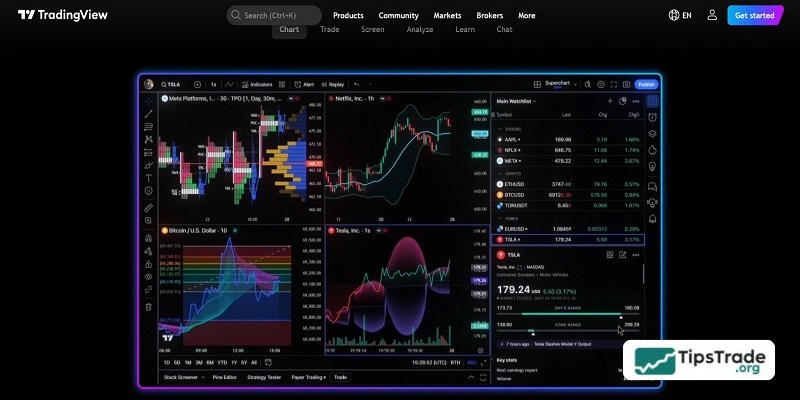
TradingView for beginners is a leading online financial charting platform widely used by traders and investors around the world. With its user-friendly interface and a wide range of technical analysis tools, TradingView is an ideal choice for both beginners and professional traders.
See more:
- What Is TradingView and How Do You Use It?
- Guide to using TradingView chart for beginners
- Explore top 5 best indicators TradingView
- Top Powerful TradingView Features Every Trader Should Know
Why is TradingView the best charting tool for beginners?
TradingView is the best charting tool for beginners for the following reasons:
- Large community: TradingView has a large user community with continuously updated and highly accurate information, making it easy to share knowledge and trading experience.
- Operating system independent: TradingView is a web-based trading platform that does not depend on any specific operating system, allowing users to easily access it from multiple devices and operating systems.
- Multi-timeframe and multi-market analysis: TradingView allows traders to analyze charts across multiple timeframes and different currency pairs and markets at the same time.
- Wide range of supported markets: In addition to cryptocurrencies, TradingView supports many other markets such as forex, oil, stocks, and various other assets.
- Intuitive and flexible charting tools: TradingView provides intuitive charting tools with multiple settings and customization options, including the most popular candlestick charts.
- Convenient trade history storage: TradingView offers a convenient trade history storage feature, enabling users to easily track and evaluate their trading performance.
How to use TradingView for beginners
To maximize the benefits of TradingView for beginners, mastering the basic steps of using the platform is essential.
Registering and setting up a TradingView account
Visit the official TradingView website and select “Get Started” or “Join for Free”. You can sign up using your email, Google, Facebook, or Twitter account. After registering, complete your personal profile to get the best experience.

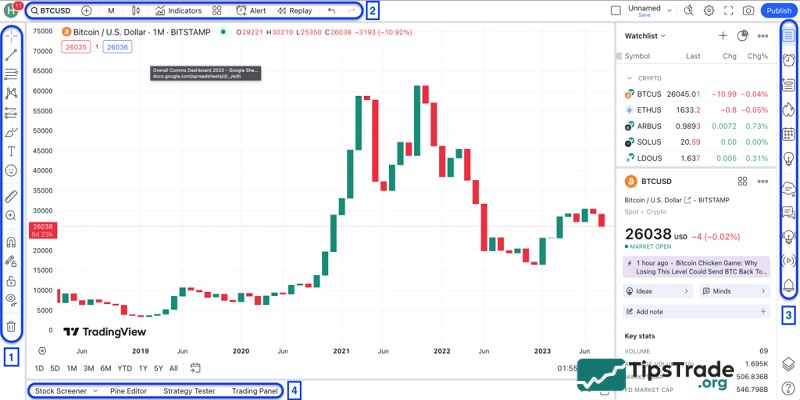
Getting familiar with the user interface
TradingView’s interface is designed to be intuitive. You will see a large chart in the center, a toolbar on the left (with drawing tools), a top toolbar (for selecting symbols, timeframes, and indicators), and panels on the right (watchlist, news, chat). Take some time to explore each section.
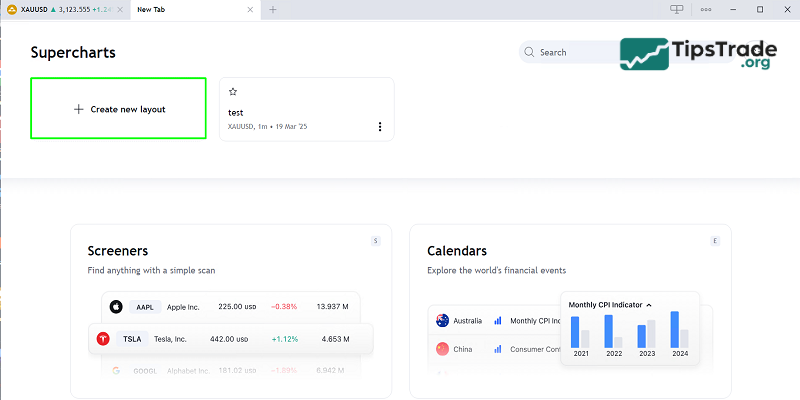
Customizing charts and layouts
To customize your chart, right-click on the chart and select “Settings”. You can change candlestick colors, background, borders, and price scales. With TradingView’s paid plans, you can create multiple chart layouts, allowing you to monitor several assets or timeframes simultaneously.
Using basic drawing tools and indicators
- Drawing tools: Click the pencil icon on the left toolbar. You will find tools such as Trend Line, Fibonacci Retracement, rectangles, arrows, and more.
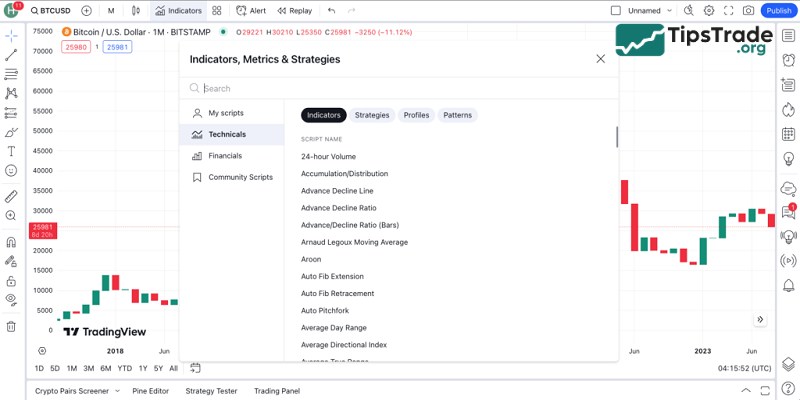
- Indicators: Click the “Indicators” (Fx) icon on the top toolbar, search for the indicator you want, and click to add it to the chart.
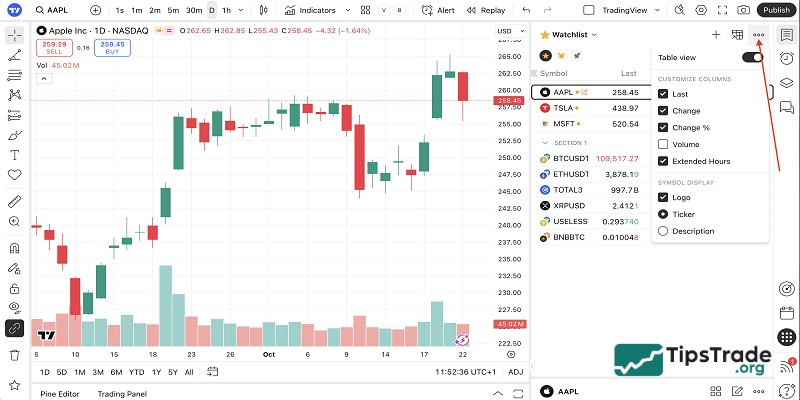
Creating and managing a watchlist
The Watchlist is located on the right side of the interface. Click the “+” icon to add assets you are interested in (e.g., BTCUSD, AAPL, EURUSD). You can create multiple watchlists to organize assets by category or trading strategy.
How to read and analyze market data on TradingView
Use charts to observe price movements and trading volume. Apply technical indicators to identify trends, support/resistance levels, and market momentum. Read news and economic events on TradingView to understand fundamental factors affecting prices.
Account plans on TradingView for beginners
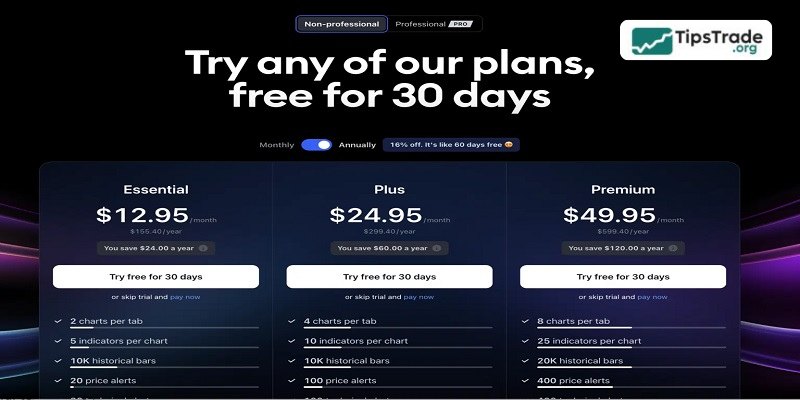
TradingView offers various service packages to suit different needs and budgets.
- Basic account: The Basic plan is free but has limited features. You can use one chart and some basic indicators, with up to 3 indicators per chart.
- Pro account ($12.95–$14.95/month): This account provides 10 alerts and 5 indicators per chart => It is suitable for experienced traders who need more advanced tools.
- Pro+ account ($19.95–$29.95/month): This account offers faster customer support and more alerts. It allows up to 4 chart layouts, simultaneous connection on two devices, and saving up to 10 chart layouts.
- Premium account ($49.95–$59.95/month): The Premium plan is the highest-tier TradingView package with almost no limitations. You can analyze up to 10 charts, use 25 indicators, set 200 alerts, and connect on up to 5 devices simultaneously.
Advanced tips and strategies with TradingView for beginners
To take your trading to the next level, make use of TradingView’s advanced features.
Combine multiple indicators to confirm signals
Instead of relying on a single indicator, combine 2–3 indicators with different functions to confirm signals. For example, use RSI to measure momentum and MACD to confirm trends, or use Moving Averages (MA) to identify the overall trend and Stochastic to find short-term entry points.
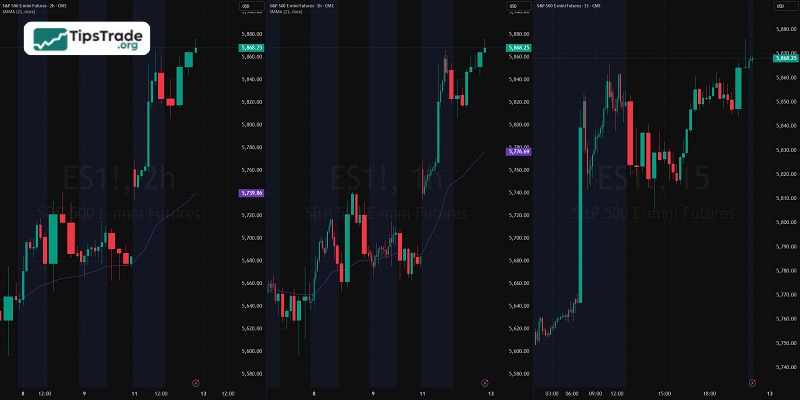
Use multi-timeframe analysis
Multi-timeframe analysis is a powerful technique. Start with higher timeframes (weekly, daily) to identify the main trend, then move down to lower timeframes (hourly, 15-minute) to find optimal entry points. TradingView makes it easy to switch between different timeframes.
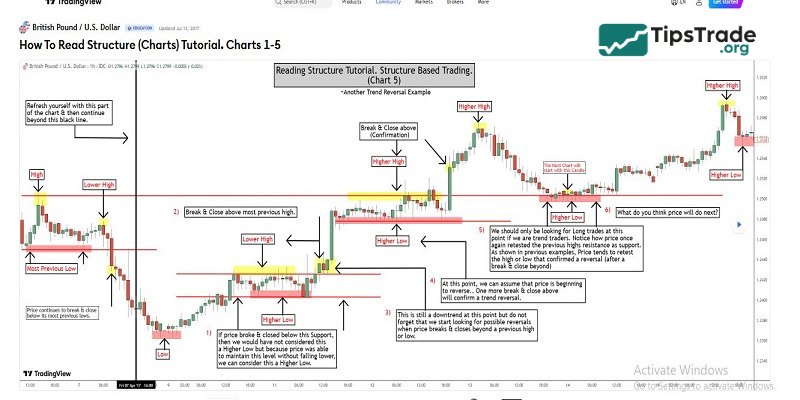
Apply candlestick and price patterns
TradingView is an ideal tool for identifying candlestick patterns (Hammer, Doji, Engulfing, Morning Star) and price patterns (Head and Shoulders, Double Top/Bottom, Triangles). TradingView’s drawing tools help you plot and identify these patterns accurately.
Build a personal trading system with TradingView
Based on the analysis and strategies you’ve learned, build your own trading system. Document your entry rules, exit rules, and risk management principles, then backtest them on TradingView to refine your strategy.
Optimize Pine Script for custom indicators and strategies
If you have basic programming skills, TradingView’s Pine Script opens up endless possibilities. You can customize existing indicators, create entirely new indicators, or code automated trading strategies for backtesting and deployment.
Final words
TradingView for beginners is a powerful tool that helps traders analyze the market and make more accurate decisions. Mastering its basic features will help you fully leverage the platform’s potential.
See more: