
TradingView chart is one of the most extremely useful technical analysis tools for traders. This article from Tipstrade.org will guide you on how to use TradingView chart effectively to make informed trading decisions. Let’s get started!
What is TradingView?
TradingView is a platform and web application launched in 2011, designed for chart analysis and the fluctuations of financial assets. Users can use TradingView to monitor, analyze, and trade in various financial markets such as stocks, currencies, and crypto. TradingView also functions as a social network, allowing users to connect with other traders and investors to learn, share ideas, and trading strategies.
This platform provides real-time market data, advanced charts, and various technical indicators, helping users make informed trading decisions. TradingView is available in both a free version and a paid version with additional features. This platform can be accessed from any device with an internet connection, allowing users to monitor and trade anytime, anywhere.
See more:
- Explore top 5 best indicators TradingView
- What is MT4? A detailed guide on how to download and use MT4
- What is MT5? Basic Guide on How to Use the MT5 Trading Platform
- MT4 vs MT5: A Detailed Comparison – Which Platform Should Traders Choose?
What makes TradingView so special?
- Advanced charting and analysis tools: TradingView offers a wide variety of charts, including candlestick, Heikin Ashi, Renko, Kagi, and many others in real time. Users can customize their charts with numerous technical indicators and drawing tools. TradingView also allows simultaneous comparison of different assets or timeframes.
- Customizable trading alerts: Users can set alerts based on price levels, technical indicators, or specific events to stay informed about important market movements. Alerts can be delivered via email, SMS, or mobile notifications.
- Community: TradingView is a social network for traders and investors where they can interact and share trading ideas. The platform allows users to publish analyses, strategies, and trade ideas. Users can also follow influential traders to gain valuable insights.
- Access anytime, anywhere: TradingView can be accessed from any device with an internet connection. Whether you’re using a desktop, tablet, or smartphone, you can monitor the markets and trade anytime.
- Paper trading: TradingView offers a paper trading feature for beginners, allowing them to practice strategies without risking real money. This virtual trading environment helps build confidence before moving on to live trading.
- Wide market coverage: TradingView covers a broad range of financial markets such as stocks, cryptocurrencies, forex, indices, and commodities. This diverse coverage ensures traders can access various trading opportunities.
Types of accounts available in TradingView
Currently, TradingView accounts are divided into two main groups: paid accounts and free accounts. Each type comes with its own features that you should be aware of.
The free account is for the standard Basic account, which only provides access to the most essential tools. This type of account is suitable for those who are new to the financial markets and are just beginning to practice chart analysis.
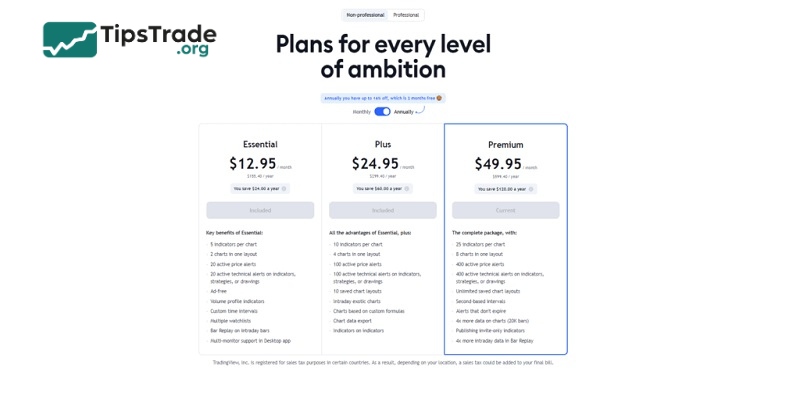
Paid accounts are for higher-level accounts such as Pro, Pro+, and Premium. Among them, the Premium account is the highest level with a cost of 49.95 US dollars. And of course, with these paid account types, you can freely access and use the tools that TradingView provides. The services they support you with are also more extensive compared to standard accounts.
Introducing the TradingView interface
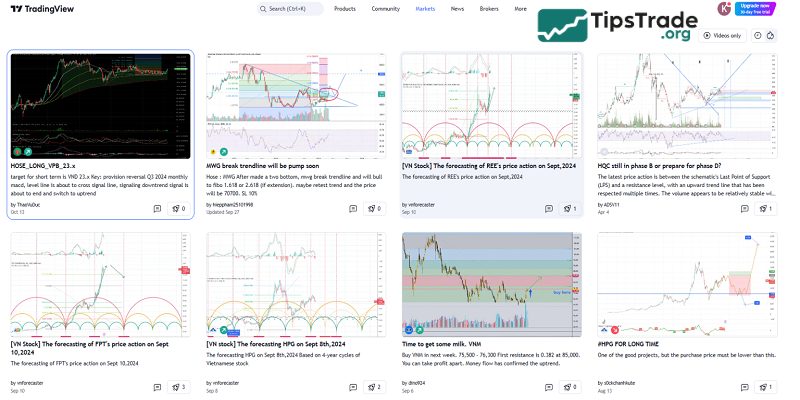
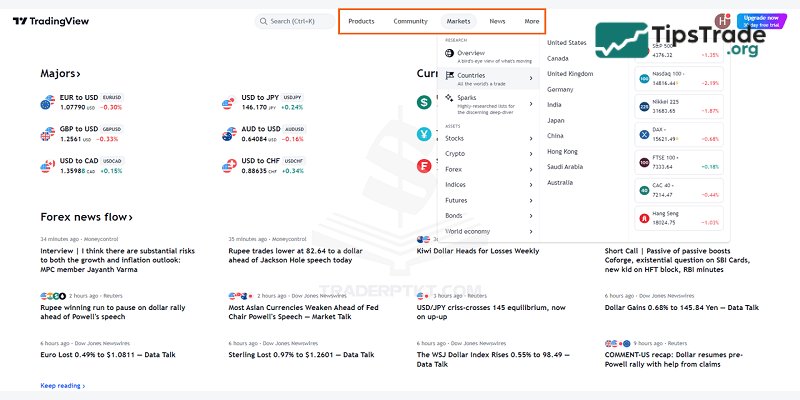
This is the TradingView homepage, which offers you countless features including:

Search bar: If you want to look for any resource available on TradingView, whether Forex, Stocks, Commodities, Indices, or cryptocurrencies, you can simply type it into the search bar.
In addition to searching for trading instruments, TradingView also allows users to search for Trading Ideas, Educational Ideas, indicators, or specific traders they want to follow.
Below the search bar, TradingView categorizes content into different sections to help traders easily navigate and stay updated, such as:
- Products: Supercharts, Screeners, Economic Calendar, and more
- Community: Overview, Livestreams, Trade Ideas, etc.
- Markets: Countries, asset classes (Stocks, Forex, Crypto, etc.)
- News: Contains information related to the economic calendar and financial news aggregated from multiple sources
- More: This section provides additional information for users, such as Shows, details about the TradingView website, Blog & News categories, and solutions TradingView offers for websites and brokers.
If you want to explore any idea or browse through specific categories, just scroll down to view more.
- The Markets section is a list of all the products available on TradingView, including indices, cryptocurrencies, currencies, stocks, bonds, futures, and more.
- Scripts: This section contains all tools and indicators that support trading, such as oscillators, trend analysis tools, different types of moving averages, and volume analysis tools.
- Filters:: Since TradingView offers a wide variety of products, this section allows users to filter assets according to their preferences. TradingView provides three types of screeners: Stock Filter, Forex Filter, and Cryptocurrency Filter.
How to use TradingView chart
Structure of the TradingView chart
Basically, TradingView has a very user-friendly design with sections that are clearly and scientifically arranged. Each section or bar contains specific information as follows:
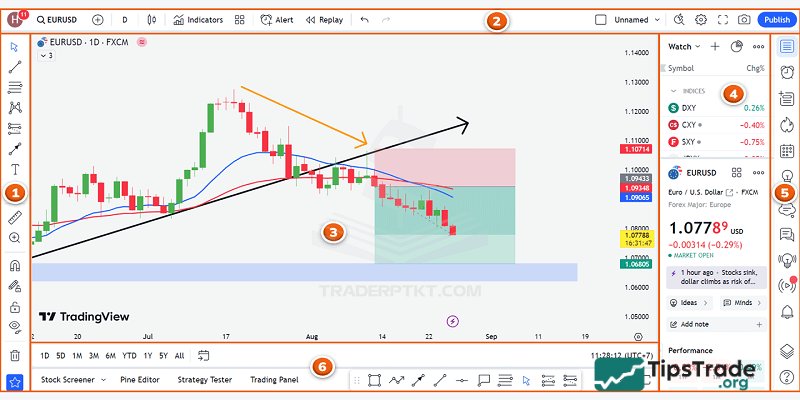
Part 1: The Left Toolbar area here contains all the drawing and measurement tools provided by TradingView. However, to use these tools completely, you need to learn and understand technical analysis.
Part 2: The top toolbar area is primarily integrated with TradingView tools related to trading symbols, trading timeframes, chart types, technical indicators, and backtesting. Specifically, the most important section in this part is the technical indicators section.
These indicators are programmed to be automatically calculated by the computer, not by the trader themselves. However, you should remember that indicators are only tools to help us easily observe the market. No indicator is a holy grail, so you should absolutely not follow any indicator in a rigid way. Instead, you should know how to combine and leverage the strengths of indicators that suit each person’s trading style.
Part 3: Main chart area – the largest section, containing the chart and where all the tools and indicators provided by TradingView are applied for price analysis.
Part 4 – 5: The Right Toolbar area contains information related to the product you created. Additionally, TradingView also integrates a news section or product price information for traders’ convenience.
Part 6: The Bottom Toolbar area is often overlooked by traders, but it’s also quite interesting. It explains why TradingView has become a complete platform with note-taking tools and the ability to open demo accounts with brokers linked to TradingView for practicing trading without necessarily registering with any broker. Additionally, TradingView also provides specific data related to stocks, Forex, or other commodities.
Specific details of the sections on the TradingView chart
Left Toolbar Area
As mentioned earlier, this is where all the tools provided by TradingView for drawing and measuring charts are located. If area 2 contains indicators that are automated, in this area the user will have to draw and measure manually. For this reason, traders need to understand the meaning of each tool, and even need to learn technical analysis to be able to use the tools provided by TradingView, such as Fibonacci retracements, Fibonacci extensions, or Gann patterns.
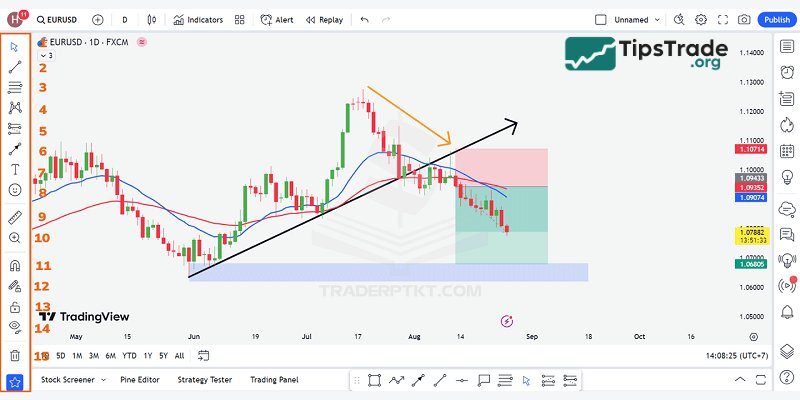
(1) Cursor: This is the part used to change the mouse pointer as desired, such as converting it into an arrow, a dot, or even an eraser. However, the most commonly used and easiest to view is the default diagonal line from TradingView.
(2) Trendlines: Just as the name suggests from TradingView, this section contains all the tools for traders to draw and find price trends, identify support and resistance zones, price channels, etc.
(3) Gann and Fibonacci Tools: This is where all the classic patterns are stored, which any trader has heard of, whether little or much, such as the GANN box pattern, the GANN fan, the Pitchfork pattern, Fibonacci retracements, and Fibonacci extensions.
(4) Model samples: Provide marking models such as: triangle patterns, ABCD patterns, head and shoulders patterns, Elliott wave patterns, or Elliott wave triangle patterns… This section, provided by TradingView, is more advanced and not all traders are proficient in using it. To use these models, you must learn and understand them before you can apply them.
(5) Prediction and measurement tools: This section helps measure price levels to determine the most appropriate R:R ratio. Or, many traders also use this section to set up or share trades with other traders to see entry points, stop-loss points, and take-profit points.
(6) Geometric shapes: helps mark and display geometric shapes on the chart for easier viewing, such as rectangles representing support and resistance zones, arrows, etc. This section is often used by traders to interpret or analyze for other traders, when they want to express their personal opinions or evaluate a particular currency pair.
This is the part that any trader is bound to use, if not the most. Please note some of the shortcuts provided by TradingView. If you frequently use lines such as horizontal lines (Alt+H), vertical lines (Alt+V), or intersecting lines (Alt+V), you should memorize these shortcuts for more convenient use.
(7) Annotation tools: this is where you can “take note” of everything you want to include in the chart. Additionally, TradingView provides other symbols like arrows and flags to help you mark and make observation easier.
(8) Symbols: To add more color and avoid rigidity in the charts, TradingView has accommodated users by providing a wide variety of different “symbols” for maximum chart personalization.
(9) Measurement tools: measure distances, count the number of candles in an area, calculate profit/loss percentage in a selected region.
(10) Zoom: This is where you can zoom in on a specific chart area for easier viewing. This feature is different from dragging with the mouse cursor, because dragging the mouse cursor will zoom out the entire chart. Here, when you use the chart tool, it automatically pulls the chart to the area you want to examine, which is convenient and saves you time from having to drag the chart to that region.
(11) Magnet Mode: Magnet in English means a magnet, which can “attract” the shelves back together, just like a magnet attracts iron. Therefore, when Magnet Mode is activated, it will cause your cursor to quickly move to the Open / High / Low / Close levels of nearby candles.
This tool is particularly useful when you draw Fibonacci retracement/extension levels and want to get the most accurate candle wicks or bodies. Or specifically anchor a support/resistance level at the open/close/high/low prices.
(12) Keep the drawing mode: In TradingView, you cannot use a single tool multiple times simultaneously; each time you draw, you have to click once on the icon in the toolbar. So, if you want to draw 10 trendlines, you’ll have to click this toolbar 10 times. It’s too time-consuming! To improve, you can use the drawing mode lock, which allows you to continuously draw one type of line or use one type of tool without having to reselect that tool again.
(13) Lock all drawing tools: It’s called “lock” because when you enable this mode, all the lines you draw will be locked and cannot be moved or extended.
(14) Hide all drawing tools: If you’ve drawn too much and don’t want to sit and “clatter” away, erasing it piece by piece, you can press this key to erase all the lines you’ve drawn previously.
(15) Clear Drawing Tools: This is where you erase all the lines you’ve drawn and all the settings you’ve made. It will be a little different from the hidden section; the hidden section is only temporary, while in this section, when you click on it, all indicators and drawing tools will disappear immediately. TradingView offers you 3 options: remove drawing tools, remove indicators, or remove both drawing tools and indicators.
Top Toolbar Area
The Top Toolbar and Left Toolbar are considered the two most important sections that any trader must master. This will make it easier for you to analyze technical charts and identify appropriate trading strategies.
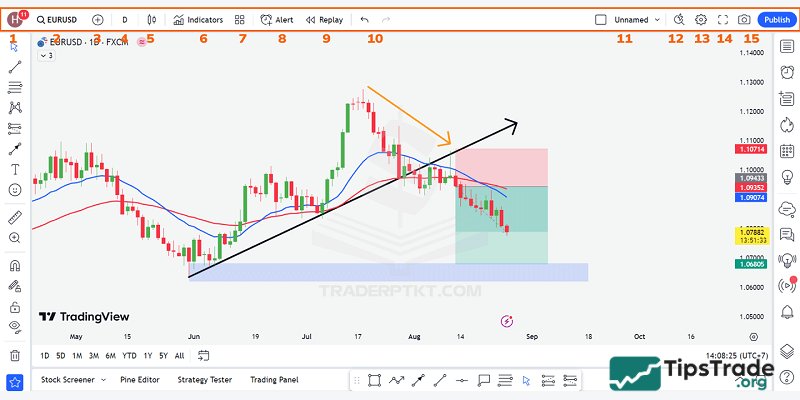
(1) Account: The outermost icon section is where all information related to your personal TradingView account is stored. Includes many basic features such as: Switching charts to Dark Mode, changing language, etc.
(2) Trading Code: This displays the symbol of the trading code for financial assets such as Forex, Crypto, and Securities.
(3) Compare or add transaction codes: This feature helps you select additional trading symbols to compare with the current trading symbol, allowing traders to see the correlation between currency pairs more clearly and accurately.
(4) Multi-timeframe: This is where all the timeframes provided by TradingView are located. Compared to MT4 software, TradingView offers more timeframes, divided into 5 sections ranging from seconds, minutes, hours, to days and regions.
Additionally, if you use the paid version, traders can also create custom timeframes for themselves. By clicking the “plus” sign in each frame, such as the hour frame, minute frame, day frame, or any other frame you want.
(5) Chart type: Provides traders with various chart type options such as candlestick, line, heiken ashi, bar chart, etc. The most commonly used chart today is the Japanese candlestick chart. Additionally, Heikin-Ashi is also a chart widely used by many traders. However, understanding and grasping candlestick charts or reversal candlestick patterns is sufficient.
(6) Strategic indicators: Most traders combine a few items from the Left Toolbar area, such as trendlines, with the indicators available in this area.
You will have access to a wide variety of indicators, from classic ones like Bollinger Bands, Moving Averages, RSI, MACD, to Ichimoku, and more. Similar to many other features supported by TradingView, indicators here are divided into two main categories: free and paid.
(7) Indicator Templates: These are templates that are built into TradingView, or you can create your own indicators to add and save them for later use without having to install them again.
(8) Create alerts: This is a feature provided by TradingView that is very useful for busy traders who cannot sit in front of their computers all day. Users can set price alerts for their desired price level (e.g., set the gold price at 1950), and when the price reaches that point (1950), a popup will appear on the screen, or they can choose to receive notifications via email or SMS.
If you use the Basic version of TradingView, you are only allowed to create 1 alert; to use more, you must delete the old alert. However, with paid versions like Premium, this feature can be used as much as desired, without limitations.
(9) Replay: This is a tool for backtesting, meaning time will be rewound to the exact point you want. For example, if the candle runs at 11 PM on January 10, 2020, the candles will move to that exact point. If you want to see how the next candles run, you can click on the forward button, and a new candle will be formed. Very suitable for backtesting EAs and price strategies.
(10) Undo or Redo: Revert to or restore the previous action.
(11) Save Chart: Where all analyses are saved. To save the chart, you can use the shortcut Alt+S. If TradingView hasn’t saved it for you yet, in case you exit, the map will still be saved.
(12): Quick Search: To search by keyword or support function, you will enter it in this search box.
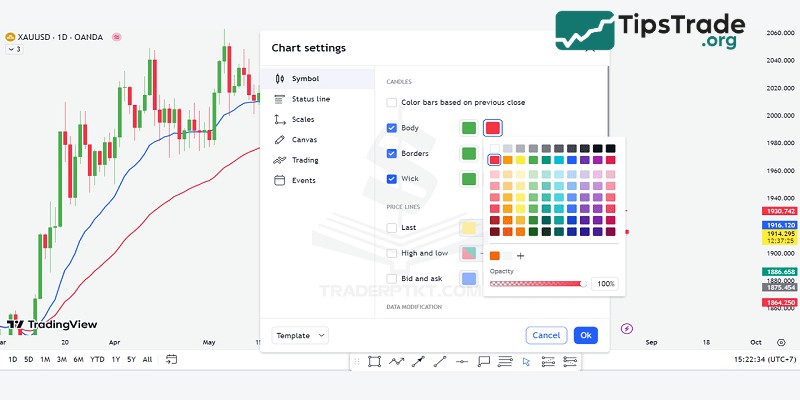
(13) Chart Settings: You can customize the chart as you wish, including candle colors, candle border colors, or changing the time frame…
(14) Full-screen mode: Uncropped Full HD for those who want to watch full-screen.
(15) Instant Photo: helps you get the image link or share photos with just one click.
Publish ideas: share ideas and analyzes with the trading community on TradingView.
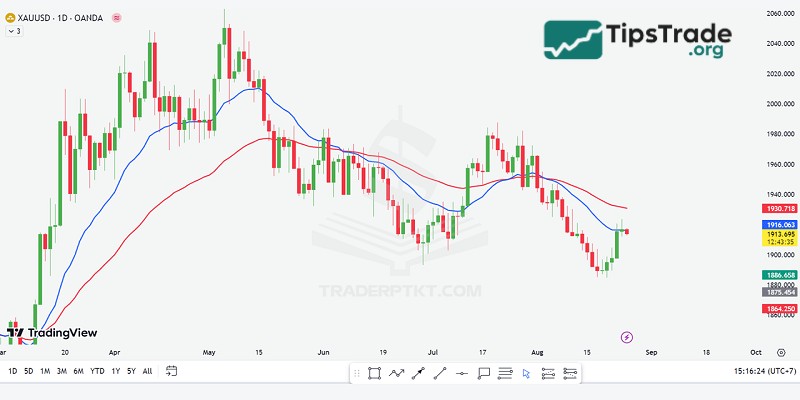
Main Chart Area
This is where the charts you need to view will be displayed. If you want to draw or install any indicators, you’ll do it here, so they’re considered the heart of the TradingView chart.
Additionally, to see more features of this area, simply right-click and the options will appear as shown in the image below:
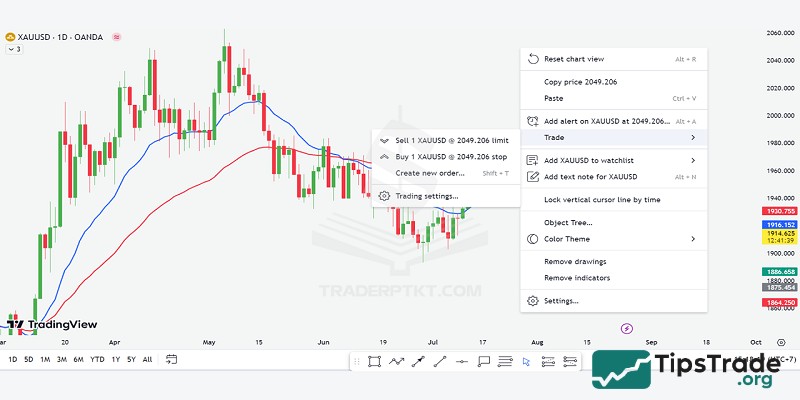
- Reset chart view: This is a feature provided by TradingView that helps traders bring the chart back to the present time. When the graph goes too far, this single button will help you return without having to drag your mouse.
The name “reset chart” might be misleading, but when using this feature, the lines and indicators are still preserved and nothing is deleted.
- Add alert on: Similar to the feature in the Top Bottom section, you can add any alerts or price levels that traders are interested in. To add an alert, simply tap the words “add alert” or use the keyboard shortcut “Alt+A”, then enter the price level you want to set the alert for. You can also enter an expiration date, or check the box for how you want to receive notifications.
- Trade: Integrated by TradingView for traders to practice trading, so the account here is a demo account, not a real account. I’m using TradingView for analysis and also using my account here for paper trading. Very convenient, right?
- Add to watchlist: This feature is similar to TradingView’s built-in watchlist feature. If a currency pair hasn’t been added to your watchlist yet, you can click on this section to track or trade it.
- Add text note: A note feature that is not displayed on the map but is located under the “text notes” section. This means these are entirely private notes, and when you share the chart with others, this note section will not appear like the notes provided by TradingView in the Left Toolbar.
- Lock vertical cursor line by time: used to mark a specific time point for a candle, making it easier to find that candle when switching to a different time frame. You can watch more videos I’ve made to better understand this feature, okay?
- Object Tree: This is a list of trading tools that the trader has added and used for that currency pair. If you want to close or remove them, you can click the “X” button.
- Theme Color: You can choose a light or dark background color. This feature has just been integrated by TradingView, adding a dark mode for users to have more options.
- Remove Drawings and Remove Indicators: Features like removing all drawing tools or removing all indicators are similar to the ones I just mentioned in the Left Toolbar.
- Chart Settings: Contains settings information to personalize the chart, similar to the Top Toolbar section of TradingView.
Right Toolbar area
This section takes up a significant amount of space in TradingView and is structured into two smaller parts: a list of currency pairs and a section for connecting with other traders.
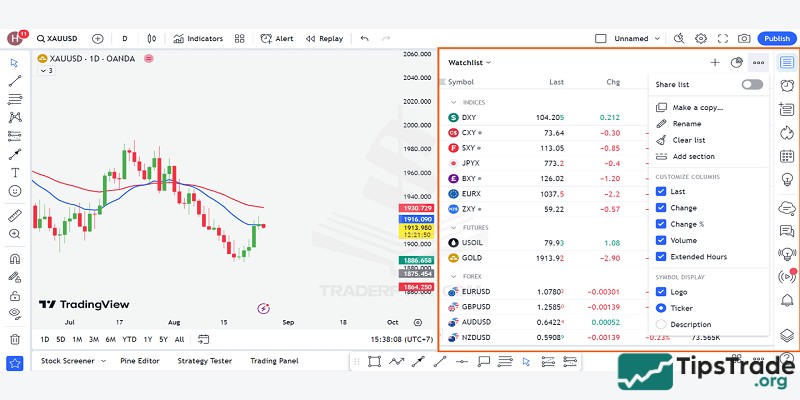
Watchlist, information on currency pairs and products: This section contains all the product pairs traders want to analyze or evaluate. TradingView is linked to many exchanges offering different prices, as well as a vast array of products from stocks, securities, cryptocurrencies, forex, and more. Therefore, traders can create and categorize product lists themselves for easier review.
In addition to managing product lists, the paid version of TradingView allows users to mark currency pairs with 5 different colors. For example, red could be for currency pairs that have fallen too sharply and need further review. The blue pairs are notable pairs for the day that need to be studied to find entry points:
In addition to the product, the bottom area of TradingView integrates news from various sources, making it convenient for traders to follow without having to visit any websites.
Social Network Connection Section: As mentioned above, this is where all information related to the connection between traders active within the same TradingView network is stored. Beside the first two parts, which were the currency list and the alert section mentioned earlier, the remaining sections are all information that helps make TradingView a complete social network.
Data Window: This is where specific information for each candlestick is provided, including opening information, the duration of the candlestick, and some details such as closing price, opening price, high price, and low price. Additionally, if you integrate any additional indicators, the information related to that indicator will be displayed below. This section is essentially the same as the one provided by TradingView in the main chart, but it’s easier to read, with the candlesticks not obscuring that information:
Hot List: a compilation of the top 10 stocks TradingView sorts by 3 criteria: bullish volume, percentage increase, and percentage decrease. The data is provided in real-time, so if you’re interested in stocks, please take a closer look at this section.
Calendar: provides information related to the Economic Calendar and the Earnings Calendar (for stock traders). This is another convenient feature; instead of having to go to Forexfactory, users can directly update upcoming events. Here’s another point to prove that TradingView is indeed a closed social network exclusively for traders.
My idea: to contain all the analyses published on TradingView so that other traders can know the perspective on a currency pair, a stock, a commodity, or cryptocurrency.
If you want to share your opinion with other traders so they can read your analysis, click the “+” sign to publish your idea. The more you publish, the more you not only practice your own analytical skills, but also gain a following to increase your credibility. And the reward you receive from TradingView is your reputation; your name is on the list of top authors.
Public Chat: Connect with other traders on the TradingView social network.
You can share your ideas here instead of publishing your analysis for other traders. Additionally, you can chat, express your views, or exchange ideas with other traders in this area. However, public chat is only available to those who pay or have at least 10 reputation points.
Private Chat: As mentioned many times, TradingView is a social network for traders, so this private chat feature is essential. This is a private messaging area for any user with a TradingView account, whether they are individuals or even TradingView administrators.
Idea Stream: The area containing trading ideas suggested by TradingView. Similarly, if you follow an author or an idea, they will appear and be updated here.
Notification: All notifications related to your account will appear in this area, including: who just liked or commented on your analysis post, or who started following you…
Order Placement: where you connect directly to a number of exchanges linked to TradingView, such as Oanda, Forex.com, and Poloniex, to place your trades.
Please note that these are all Demo accounts, similar to the demo accounts provided by forex brokers for practicing order placement. These are not real account transactions, everyone.
For this reason, as soon as you connect and choose a floor, you will receive 00,000 in your account to practice trading. If you want to increase this amount, you can change it to any amount you like. I will discuss this issue in detail in the Paper Trading or Trading Board section later on.
DOM: is an abbreviation for Depth of Market (liquidity depth or market depth), where you can see the entire Bid/Ask price levels. At DOM, you can also choose to execute a pending order or a market order:
New Object Tree: Multi-Select Drawing Tools: Similar to the object list sections above, this section contains information about the currency pair, indicators, and trendlines currently in use or being drawn.
Help: A hidden toolbar at the bottom is used to request support from admins or request additional features you want.
Bottom Toolbar Area
This is a place you don’t need to worry about too much if you don’t have time to explore. Because they only contain a few tools like a forex filter, text notes, Pine Editor, strategy tester, and most notably, Paper Trading.
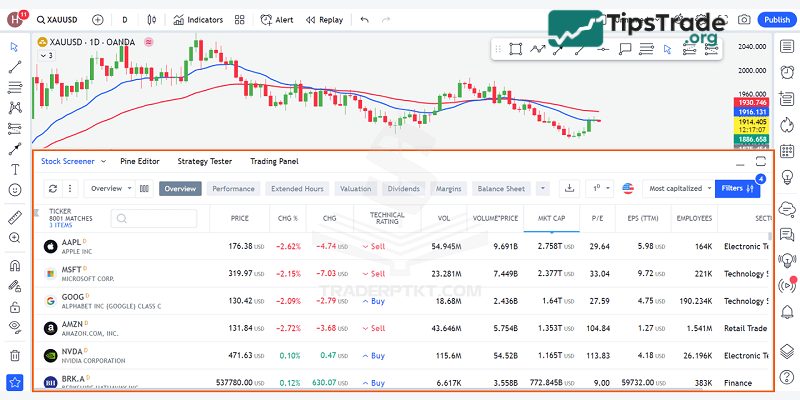
Forex filter: In addition to forex, TradingView also provides additional information about stocks or cryptocurrencies here. This area will contain a lot of information related to the buying and selling prices of one currency compared to other currencies.
If you have a lot of knowledge related to fundamental analysis and currencies, this is the place to get the most comprehensive overview of that currency.
Text notes: This notes category previously appeared in the main chart area under the name “add notes,” as mentioned above. So when you write notes here, they won’t appear on the chart but will be neatly tucked away in this section, and you’ll have to open them to see them.
Paper Trading: TradingView cleverly arranges for certain sections and tools to be repeated and appear in different toolbars for traders to use, and paper trading is no exception. Essentially, this is just a TradingView demo account linked to a few exchanges, allowing you to practice trading. So, when you want to use this feature, you can click on “Trading Board,” which will bring up a “Paper Trading” window. Click on that to link your account, then click on the word “connect.”
Since this is just a demo account, after “connecting” your account, you will be immediately credited with 00,000 USD to trade, without needing to verify your account with KYC or anything else.
Final thoughts
This is all the information that Tipstrade.org provides you about how to use TradingView chart. Hopefully, new individual traders familiarizing themselves with the financial market will gather much useful data for themselves.