
Continuation patterns often indicate that the market trend may continue in the same direction. If you are a trend trader, these patterns can provide the best trading opportunities. Below are the top 5 most common continuation patterns you should know.
What are continuation patterns?
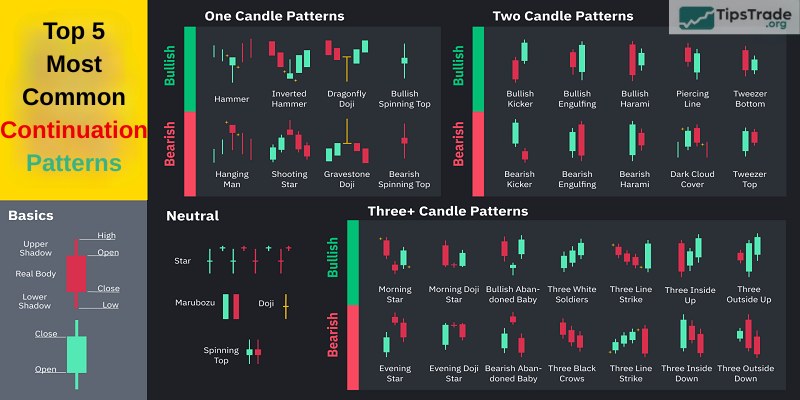
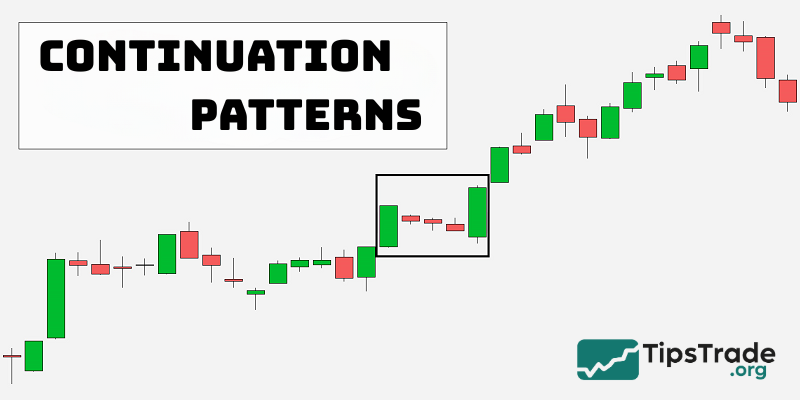
Continuation patterns are candlestick patterns in technical analysis used to predict the next market trend after a short-term correction period. These patterns will appear when the price is in an uptrend or downtrend and shows signs of continuing the current trend.
>>See more:
- Best Popular Types of Reversal Patterns In Trading
- All useful chart patterns in technical analysis you should know
- Basic price charts in trading and how to read each type
- Mastering candlestick patterns for effective trading
Benefits of continuation patterns in trading
Continuation patterns are important indicators in financial investment. Some benefits of continuation patterns include:
- Confirming the trend: Continuation patterns help investors confirm the trend at the time of viewing. From this, it’s possible to predict the next market trend and make buy/sell decisions.
- Risk management: Continuation patterns help indicate current trends and signals about the near-future market. From there, risk tolerance and position size can be considered based on the model.
- Determine entry and exit points: Continuation patterns indicate suitable buying/selling points based on the market’s upward/downward trend. This allows for maximizing profits or minimizing risks as much as possible based on the model.

Top 5 most common continuation patterns
If you’ve understood the importance of continuation patterns and their unique benefits, let’s explore the diverse types of continuation patterns that are quite popular and provide extremely good signals in the current financial market.
There are five quite common continuation patterns in the market that you need to know. Each type of continuation pattern will have different characteristics and ways of recognition, bringing unique meanings and signaling messages to investors. Let’s learn about the characteristics, significance, and application of continuation patterns with us right now.
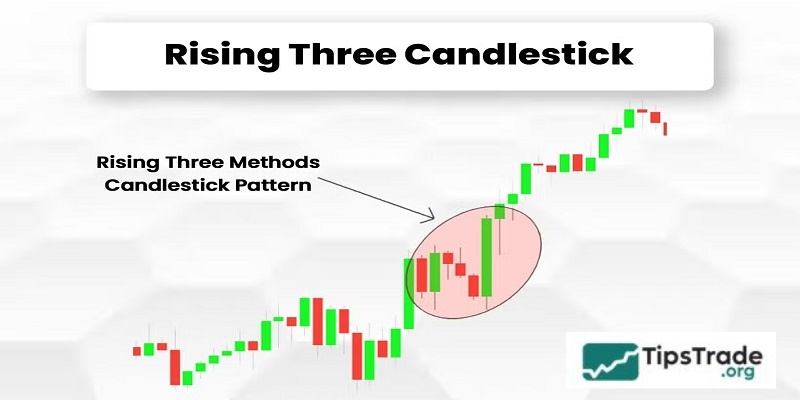
Rising Three Methods
The Rising Three Methods candlestick pattern is used to predict the continuation of an uptrend after a short-term correction period. This model consists of 5 different candles (2 bullish candles, 3 bearish candles).
Characteristics of the Rising Three Methods pattern:
- The first candle will show a strong price increase from a previously established trend.
- The 2nd, 3rd, and 4th candles have small bodies and are located between the 1st and 5th candles. These candles will show a slight decrease, indicating that some investors are choosing to sell during this time.
- The fifth candle shows a strong price increase, similar to the first candle. However, the closing price of the 5th candle will be higher than the closing price of the 1st candle.
The meaning of candles in the Rising Three Methods pattern:
- The first candle showed a strong price increase, indicating rising buying demand, which resulted in a very high closing price for the session.
- The 2, 3, and 4 candles indicate that buyers are showing signs of selling to take profits. Additionally, some retail investors are catching up with the trend, causing a slight market decline.
- The fifth candle shows that buyers are dominating sellers, causing prices to trend strongly upwards again.
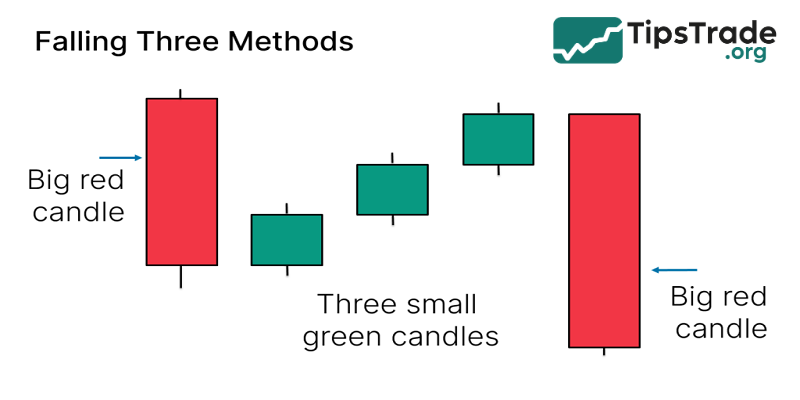
Falling Three Methods
The Falling Three Methods candlestick pattern is used to predict the continuation of an uptrend, consisting of 5 candles (2 bearish candles, 3 bullish candles).
Characteristics of the Falling Three Methods pattern:
- Candle 1: A long black candle, indicating a downward trend in the market.
- 2nd, 3rd, and 4th Candles: The next 3 small-bodied candles (green or white) tend to be bullish. However, these candles should not exceed the highest or lowest level of the first candle.
- The 5th candle: Another long black candle. This candle must close below the previous candle and lower than the closing price of the first candle.
The meaning of candles in the Falling Three Methods pattern:
- The first candle shows a selling trend among investors and has a very low closing price.
- The second, third, and fourth candles indicate that investors are taking profits. While some retail investors are buying at the lower price. The evidence is that candles 2, 3, and 4 show a slight upward trend.
- The fifth candle indicates that the selling trend continues to increase. And the price will continue to decrease, possibly even closing lower than the closing price of the first candle.
Bullish Harami
The next continuation pattern is the Bullish Harami. This is considered a model that operates steadily and best during an uptrend. This will provide a certain indication that the buyers are taking a break and are likely to return and create a stronger upward trend.
The Bullish Harami candlestick pattern consists of 2 candles and has the following characteristics:
- The candle on day 1 has a wick that tends to decline sharply and a body that is significantly larger than the body of the candle on the following day.
- The candle on the second day has a very small body and shadow. This candle will undergo a certain change and has a slight upward trend.
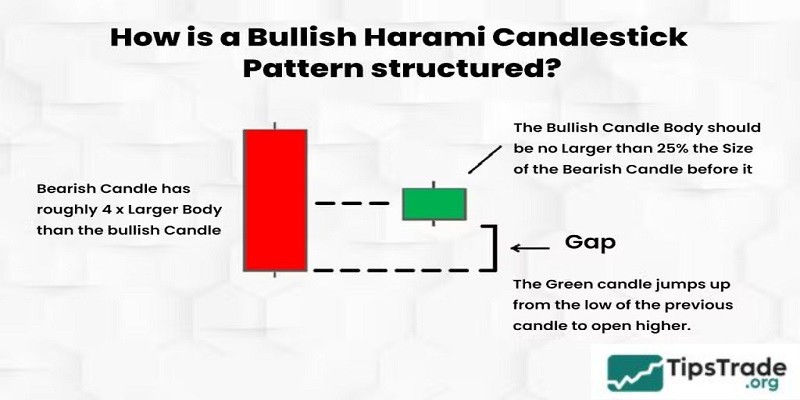
Meaning of the Bullish Harami pattern:
- The Day 1 candle shows a large sell-off occurred, causing the candle to trend strongly downward.
- On the second day, prices fluctuated slightly, indicating that neither side was gaining the upper hand. The indecision of the Harami pattern suggests that the price could move sideways or reverse upwards because sellers are gradually becoming exhausted.
Bearish Harami
The Bearish Harami is a type of candlestick pattern that also tends to indicate a decline in price action and is quite common. This is a strong and extremely accurate signal indicating that sellers are taking a break and investors are likely to return at the same time.
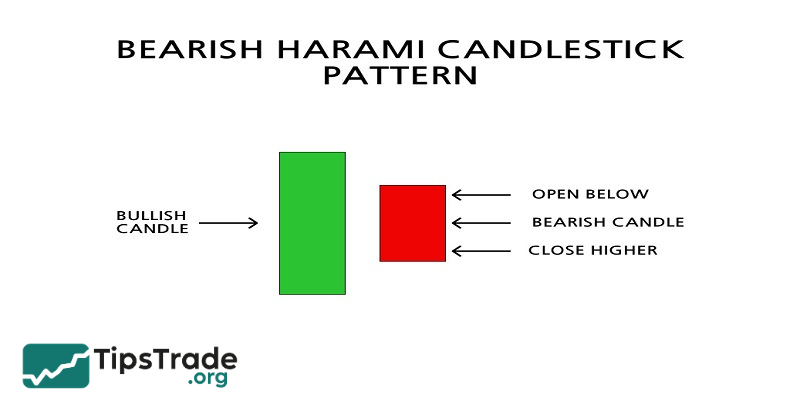
Characteristics of the Bearish Harami candlestick pattern:
- The first day’s candle shows a strong upward trend and has a larger body compared to the next day’s candle.
- The second day’s candle has a small body, indicating a downward trend.
The Bearish Harami candlestick pattern indicates a weakening of the uptrend and a short-term reversal into a downtrend. This is a sign that investors should consider opening a short position to make a profit.
Upside Gap Tasuki
Upside Gap Tasuki is a type of candlestick pattern that appears when the market is experiencing an upward price trend and has specific characteristics, including upward gaps.
This pattern consists of 3 candles and has the following characteristics:
- The first candle is a long white candle, indicating an upward trend.
- The second candle has a small white body and also shows an upward trend. Additionally, there will be a gap between candle 1 and candle 2, indicating an increase.
- The third candle is a bearish candle, opening below the closing price of the second candle.
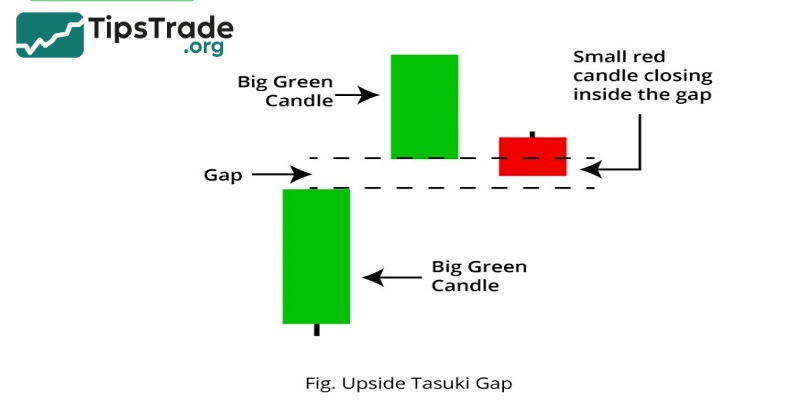
Meaning of the Upside Gap Tasuki candlestick pattern:
- The Upside Gap Tasuki candlestick pattern indicates that the closing price of the third candle is an ideal entry point, and the upward gap between the first and second candles is considered a support area.
- Investors chose to buy at the closing price of the third candle within the window price range, which is considered a support area for an immediate continuation of the uptrend.
Notes when using continuation patterns in trading strategies
Just like many other patterns, continuation patterns are merely a tool to assist investors in their decision-making process. When using continuation patterns, traders need to keep the following points in mind:
- Continuation patterns do not guarantee a 100% profit for investors. Currently, there are many candlestick patterns in the market, which can be confusing when identifying them. Therefore, investors need to carefully consider the model before entering any position.
- Investors should combine the continuation pattern with various other indicators. This helps increase the accuracy rate in predicting candlestick patterns. From there, risks in the investment process can be minimized.
- A reversal candle formed before a trend is complete is not valid. Therefore, continuation patterns formed when the market is sideways are also not counted.
Conclusion
The above is basic knowledge about what continuation patterns are and the common continuation patterns currently. Hopefully, this article can provide useful value to investors in their decision-making process. Follow the Technical Analysis section on Tipstrade.org to update your useful knowledge every day!