
The Three black crows candlestick is one of the most powerful bearish reversal candlestick patterns in technical analysis. It signals the likelihood that the market is about to enter a downward phase. Join Tipstrade.org to explore the definition, how to identify it, its meaning and trading strategies related to the Three Black Crows candlestick.
What is the Three black crows candlestick?
The Three Black Crows candlestick is one of the most important reversal patterns in technical analysis. This pattern is formed when three consecutive bearish candlesticks appear on the chart, in which:
- The closing price of each candlestick is usually near the lowest level of the trading session.
- The opening price of the following candlestick is typically equal to or very close to the closing price of the previous one.
The appearance of this pattern indicates that selling pressure is completely dominating and that the prior uptrend is gradually losing momentum. Therefore, the Three Black Crows candlestick is often considered a highly reliable signal of a reversal from an uptrend to a downtrend. This pattern is the opposite of the Three White Soldiers candlestick.

See more:
- Spinning Top Candlestick and How to Apply It in Technical Analysis
- How to Use the Hammer Candlestick for the Most Effective Trading
- Shooting Star Candlestick Pattern: How to Identify and Trade It Effectively
- What is a Doji candlestick pattern? Common Doji candlestick patterns in investing
How to identify the Three black crows candlestick?
In general, traders can easily identify the Three black crows candlestick with the naked eye. However, to ensure accuracy and avoid missing reliable trading signals, traders should also keep in mind the following key identifying characteristics:
- The pattern is formed by three consecutive black (or red) candlesticks on the stock price chart.
- The pattern is considered more reliable if the lengths of the three candlesticks are approximately equal or gradually increasing.
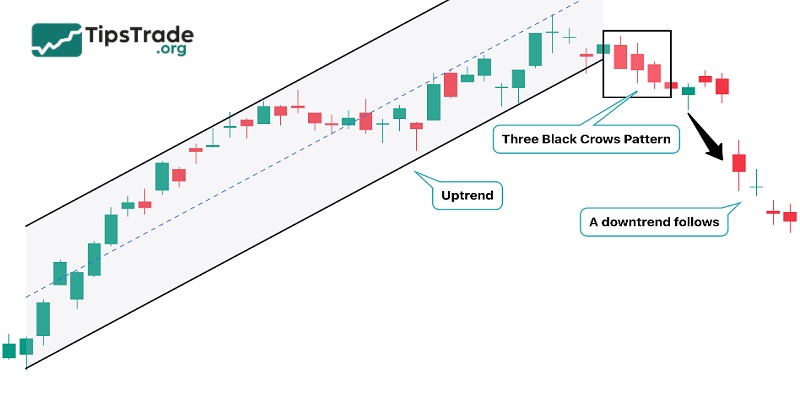
- This pattern typically forms at the end of an uptrend or during a corrective rebound within a downtrend.
- The Three black crows candlestick indicates a strong deterioration in market sentiment, often viewed as a signal of a reversal of the current bullish trend.
- To confirm the reliability of the pattern, investors often use other technical indicators such as moving averages, RSI, MACD, etc., to assess the market and make appropriate trading decisions.

Meaning of the Three black crows candlestick in technical analysis
The Three black crows candlestick is regarded as an important signal in technical analysis, indicating the weakening of an uptrend and the potential emergence of a bearish reversal.
When three consecutive bearish candlesticks form on the chart, it reflects a clear decline in buying strength while selling pressure continues to increase, pushing prices sharply lower. This is often a sign that the market is entering a period of heightened volatility and confirms that the previous uptrend may have come to an end.
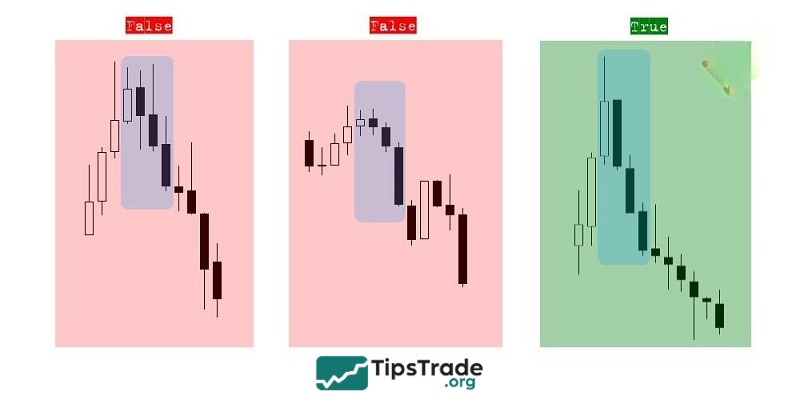
The size of the candlestick bodies and the length of the wicks within the pattern also help traders assess the reliability of the signal:
- Three long candlesticks with solid bodies and short wicks indicate strong selling pressure and reinforce the likelihood of a reversal.
- Conversely, if the candlestick bodies are small or the wicks are long, the movement may represent only a temporary correction.
This pattern has an opposite meaning to the Three white soldiers pattern, helping investors clearly identify the shift between two distinct market sentiment phases.
How to trade with the Three black crows candlestick
To trade effectively with the Three black crows candlestick, traders typically go through two basic steps: identifying the reversal signal and setting up a sell order.
Step 1: Identify the reversal signal
First, traders need to recognize the factors confirming that the uptrend has weakened and may reverse to the downside. Two common signs include:
- A break below the previous low: the closing prices of the candlesticks in the pattern fall below the most recent swing low.
- Formation of lower highs and lower lows: the pattern creates a lower high compared to the previous peak and a lower low compared to the previous trough, indicating that a downtrend is beginning to form.
To reduce risk, traders should combine this pattern with other technical analysis tools (such as moving averages, RSI, MACD, and trading volume) to confirm the reliability of the signal.
Step 2: Set up the sell order
Once the reversal trend has been confirmed, traders can consider the following entry approach:
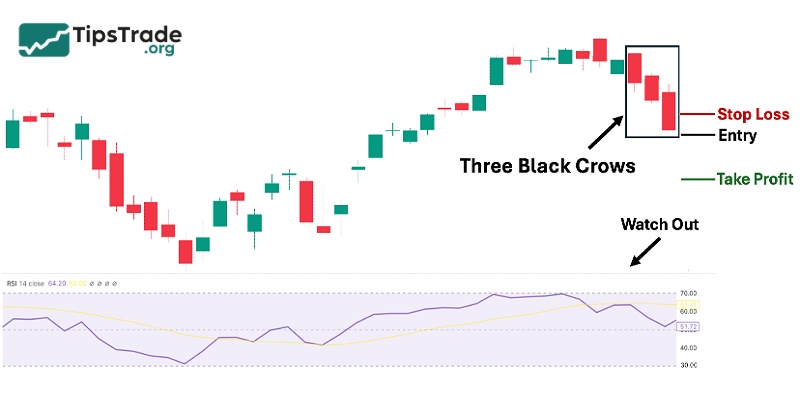
- Entry point: place a SELL order as soon as the Three black crows candlestick is completed, typically below the third bearish candlestick.
- Stop-loss: should be set at the nearest recent high before the pattern formed, that is, the highest price level prior to the start of the reversal.
- Take-profit: can be placed at a key support level formed earlier, where the price is likely to bounce.

Combining the Three black crows candlestick with technical indicators
In practice, the appearance of the Three Black Crows pattern does not always lead to an immediate bearish reversal. In many cases, prices may continue their uptrend even after the pattern forms. Therefore, to minimize risk and improve accuracy, traders should combine this pattern with other technical indicators.
Three Black Crows with Relative Strength Index (RSI)
One useful indicator is the RSI (Relative Strength Index). When the Three black crows candlestick appears during an uptrend while the RSI simultaneously enters the overbought zone (RSI > 70), this is considered a highly reliable signal that the market is about to reverse from bullish to bearish. At this point, traders can confidently place a SELL order to anticipate the new downtrend.
Three Black Crows with the SMA 30
In addition to RSI, traders can also use the SMA 30 moving average to confirm the signal. If the price moves downward and breaks below the SMA 30, it indicates a high probability of a trend reversal. When this signal aligns with the Three black crows candlestick, the reliability becomes even stronger, helping traders confidently enter SELL positions and optimize profits.
Sample trading strategy using the Three black crows + RSI + SMA 30
This is how to apply the Three black crows candlestick in combination with the RSI indicator and the SMA 30 moving average to increase the reliability of trade entries:
Step 1: Identify the Three black crows candlestick
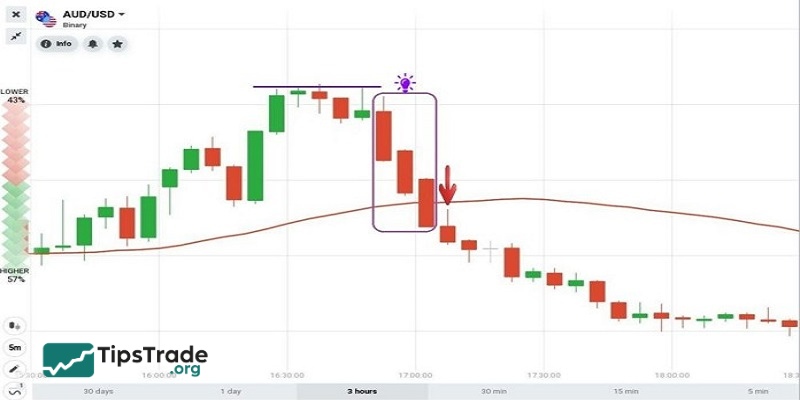
- On the price chart, observe the appearance of three consecutive bearish candlesticks with long bodies, closing near their lowest levels and opening at or near the closing price of the previous candlestick.
- This is the basic signal of the Three black crows candlestick.
Step 2: Check the signal with RSI
- Observe the RSI indicator: if the RSI is in the overbought zone (RSI > 70) at the time the pattern forms, the probability of a bearish reversal becomes more reliable.
- At this point, the RSI serves as confirmation that market sentiment has reached an extreme level of optimism and a correction is likely.
Step 3: Confirm with SMA 30
- Add the SMA 30 line to the chart.
- If, after the pattern forms, the price breaks and moves below the SMA 30, this provides an additional technical signal confirming that a downtrend has begun.
Step 4: Set up the trade
- Entry: Place a SELL order just below the third candlestick of the pattern once the RSI and SMA signals are confirmed.
- Stop-loss: Set at the nearest recent high before the pattern formed.
- Take-profit: Place at a key support level or at a target price based on an appropriate risk–reward ratio (R:R), typically 1:2 or higher.
Pros & cons of the Three black crows candlestick
With this table, traders can quickly compare the advantages and disadvantages to know when to apply the strategy and when to be cautious.
Pros:
| Advantage | Description |
| Strong reversal signal | Clearly reflects a shift in market sentiment from buyers to sellers. |
| Easy to identify | Consists of three consecutive bearish candlesticks with long bodies, making it easy to spot with the naked eye. |
| High reliability when combined with indicators | When used together with RSI, MACD, or SMA, the pattern becomes a highly reliable signal. |
| Flexible application | Can be applied across stocks, indices, commodities, and the forex market. |
Cons:
| Disadvantage | Description |
| Not 100% guaranteed | False signals may occur when prices continue to rise after the pattern forms. |
| Context-dependent | In sideways markets or low-liquidity conditions, the signal becomes less reliable. |
| Signal lag | The pattern is only confirmed after three consecutive candlesticks have formed, which may cause traders to miss early entry opportunities. |
| Risk of misinterpretation | Beginners may mistake any three consecutive red candles for Three Black Crows, overlooking the pattern’s position and specific candlestick characteristics. |
Conclusion
In summary, the Three black crows candlestick is a useful tool in technical analysis that helps investors identify potential trading opportunities. However, to use this pattern effectively, investors should combine it with other indicators and apply appropriate risk management measures. Follow Tipstrade.org to learn more about other useful candlestick patterns!
See more: