
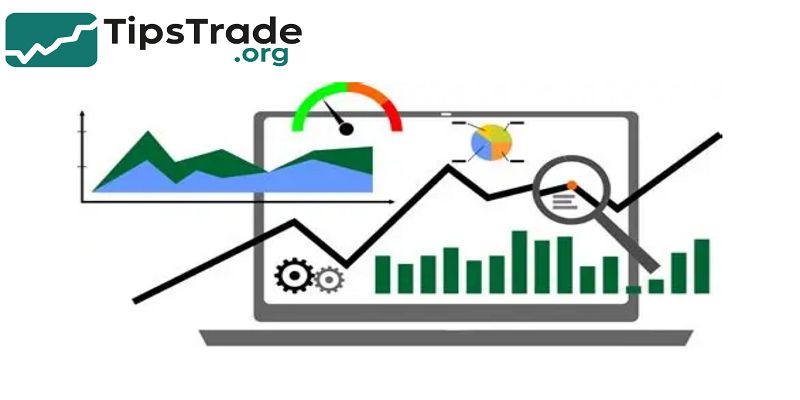
Technical analysis stock a widely used method that involves analyzing historical price and volume data of stocks to predict future market trends. Unlike fundamental analysis which examines a company’s financial health, technical analysis focuses on chart patterns and technical indicators to identify potential buying and selling opportunities. This approach helps traders make informed decisions by understanding market sentiment and price movements, making it an essential tool for investors seeking to maximize returns efficiently.
What Is Technical Analysis Stock?
- Technical analysis is the study of past market data—mainly price and volume—to predict future movements.
- It assumes that historical trading activity tends to repeat because investor behavior follows recognizable patterns.
- In contrast, fundamental analysis examines earnings, balance sheets, and economic indicators to determine a company’s intrinsic value.
- Technical analysts focus solely on what the price is doing, not why.
- By using charts and indicators, traders identify potential entry and exit points.
- For example, when a stock price breaks above its moving average, it might signal a bullish trend.
- According to the CFA Institute, over 70% of active traders use technical analysis tools daily to guide their trades.
- Whether you’re a beginner or a professional, understanding how to read price charts gives you a competitive edge.
>>See more:
- ADR Stocks: A Complete Guide for Global Investors
- Growth Stocks – Definition, Examples, Characteristics
- Preferred Stock – What It Is, How It Works, and Should You Invest?
- Everything You Need to Know about Sustainable Stocks
Core Principles of Technical Analysis

Price Reflects All Available Information
- Every piece of public and private data—from earnings to global news—is already reflected in the stock’s price.
- This principle aligns with the Efficient Market Hypothesis, suggesting markets discount all known information.
Prices Move in Trends
- Markets rarely move randomly. Instead, they form identifiable uptrends, downtrends, or sideways movements. Recognizing the direction of a trend helps traders align their strategies. “The trend is your friend” is a timeless saying in trading circles.
History Tends to Repeat Itself
- Patterns emerge because human psychology drives market behavior. Fear and greed cause traders to react similarly in comparable situations.
- As a result, chart patterns such as Head & Shoulders or Double Tops tend to reappear across time frames.
- Together, these principles form the foundation of all technical trading systems, from simple moving averages to advanced algorithmic models.
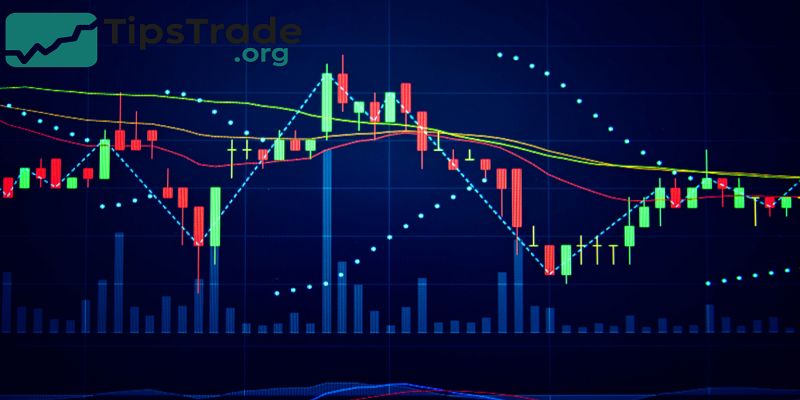
Common Tools and Indicators in Technical Analysis
Technical indicators help traders interpret market data objectively. They are usually divided into four categories: trend, momentum, volume, and volatility.
Moving Averages & MACD
- Moving averages (MA) smooth out price data to identify trends over a given period.
- A short-term MA crossing above a long-term MA signals upward momentum (the “Golden Cross”).
- MACD (Moving Average Convergence Divergence) measures momentum changes by comparing two MAs.
- When the MACD line crosses above the signal line, traders often view it as a buy signal.
RSI & Stochastic Oscillator
- RSI (Relative Strength Index) gauges overbought or oversold conditions on a 0–100 scale.
- RSI above 70 suggests a potential price correction; below 30 indicates a possible rebound.
- Stochastic Oscillator compares closing prices to recent price ranges, showing whether momentum is gaining or fading.
OBV & Volume Profile
- On-Balance Volume (OBV) links price changes with trading volume.
- A rising OBV confirms a bullish move, while divergence may warn of trend weakness.
- Volume Profile visualizes where most trading occurred, helping identify key support and resistance levels.
Bollinger Bands & ATR
- Bollinger Bands plot price deviations around a moving average, signaling when prices are unusually high or low.
- Average True Range (ATR) measures market volatility; high ATR means wider price swings.
Popular Chart Patterns Every Trader Should Know
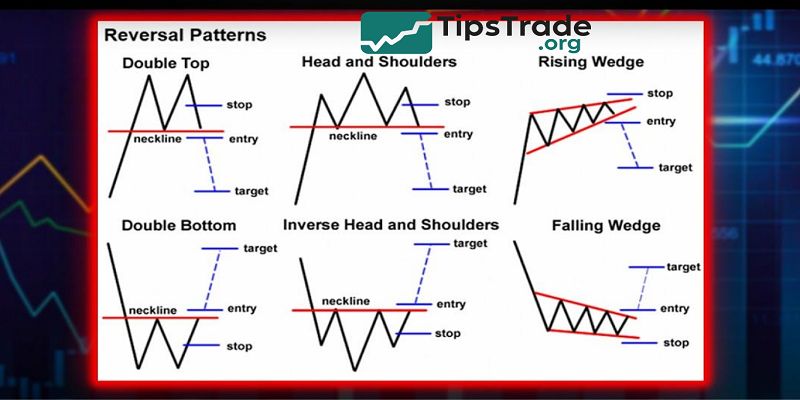
Patterns in price charts represent crowd psychology and market sentiment. Learning to recognize them allows traders to anticipate reversals or continuations.
Head & Shoulders, Double Top/Bottom
- A Head & Shoulders pattern signals a shift from bullish to bearish momentum.
- A confirmed neckline break often precedes a downtrend.
- Double Tops and Bottoms indicate failed attempts to break resistance or support, hinting at an impending reversal.
Triangles, Flags, Pennants
- These patterns suggest a pause before the existing trend continues.
- Ascending triangles typically precede breakouts, while flags and pennants form after sharp moves, consolidating before resuming the direction.
Doji, Engulfing, Hammer
- Candlesticks visualize price emotion. A Doji shows indecision, while a Bullish Engulfing candle suggests strong buying pressure.
- Hammer candles, appearing after a decline, often signal potential trend reversals.
- Mastering chart patterns helps traders recognize opportunities earlier and manage risk more effectively.
How to Apply Technical Analysis in Stock Trading
Applying technical analysis is both art and science. Successful traders combine analytical tools with disciplined risk management.
- Identify the Trend: Use moving averages or trendlines to determine whether the market is bullish, bearish, or neutral.
- Find Entry Points: Combine RSI, MACD, and support/resistance levels to time entries.
- Set Exit Points: Use stop losses below support zones and take-profit levels based on chart targets.
- Confirm with Volume: Breakouts with strong volume are more reliable than those with weak participation.
For example, a trader analyzing Tesla (TSLA) might notice a bullish breakout above $250 with high OBV readings. This indicates institutional buying pressure — a classic confirmation of trend strength.
Technical analysis doesn’t guarantee profits, but it dramatically improves the odds of making consistent, data-driven decisions.
Common Mistakes Traders Make with Technical Analysis
Even experienced traders fall into traps when using technical tools. Avoiding these mistakes can save your portfolio from unnecessary losses.
- Overusing Indicators: Stacking too many indicators can lead to analysis paralysis. Stick to 3–5 complementary tools.
- Ignoring Market Context: Technical signals work best when aligned with broader market trends and sentiment.
- Chasing Confirmation Bias: Traders often see what they want to see. Stay objective and validate your setups.
- Neglecting Risk Management: Without clear stop losses, even the best analysis can fail.
- Lack of Practice: Backtest your strategy on historical data before trading live.
A 2023 study by Journal of Financial Markets found that traders who combined technical and fundamental analysis achieved 12% higher returns than those relying on a single method.
How to Learn and Practice Technical Analysis
Mastering technical analysis requires structured learning and hands-on practice.
- Start with Basics: Learn how charts, timeframes, and price actions work. Websites like Investopedia and BabyPips offer free tutorials.
- Use Charting Platforms: Tools such as TradingView, MetaTrader 5, or ThinkorSwim allow you to visualize and test strategies.
- Backtesting: Apply your system on past data to see how it performs.
- Join Trading Communities: Online forums and Discord groups expose you to different perspectives.
- Continuous Learning: Follow expert traders and read authoritative books like “Technical Analysis of the Financial Markets” by John J. Murphy.
Consistency matters more than complexity. Spend time understanding why signals form — not just what they mean. Over time, you’ll develop intuition for market rhythm.
Advanced Technical Analysis Concepts

Once you master the basics, dive deeper into advanced topics that refine prediction accuracy.
Fibonacci Retracement & Extensions
- Based on the Fibonacci sequence, these levels identify potential support and resistance zones.
- Traders often use the 38.2%, 50%, and 61.8% retracement levels to spot pullbacks.
Elliott Wave Theory
- Proposed by Ralph Nelson Elliott, this theory suggests markets move in repetitive 5-wave impulsive and 3-wave corrective cycles, reflecting investor psychology.
Divergence Analysis
- When price makes higher highs but RSI makes lower highs, a bearish divergence forms — often an early reversal warning.
Algorithmic and AI-Driven Trading
- Today, hedge funds and retail traders use machine learning to detect hidden patterns beyond human perception.
- AI algorithms process millions of data points to generate buy/sell signals with high precision.
While these concepts are complex, understanding them expands your analytical toolkit for dynamic markets.
Conclusion
Technical analysis is more than drawing lines on a chart — it’s a systematic way to understand market psychology and price action. By learning how to identify trends, patterns, and indicators, traders can make informed, emotion-free decisions. Whether you’re analyzing Apple’s breakout, spotting divergences in the S&P 500, or testing your strategy on tipstrade.org, the key lies in discipline and continuous learning.
See more: