
What is technical analysis in CFD trading? You may have come across this term when learning about financial markets, especially contracts for difference. It is not just a technical concept, but also a powerful tool that helps traders forecast price trends and make informed trading decisions. In this article, Tipstrade.org will help you gain a deeper understanding of technical analysis in CFD trading, from its fundamental principles to the tools and practical applications used in CFD trading.
What is technical analysis in CFD?
Technical analysis in CFD trading is a method of studying past price charts to predict future trends. Unlike fundamental analysis (which tracks economic news and central bank policies), technical analysis in CFD focuses entirely on price action and trading volume.
Three core principles:
- Price reflects everything – all information is already incorporated into the price.
- Price moves in trends – it is not random.
- History repeats itself – human psychology changes very little.
See more:
- What is CFD trading and how does it work for traders
- Top 6 Best CFD Indicator Tools Every Trader Should Know
- Common Types of CFD Cost and How They are Calculated
- Common CFD Asset Types and How to Choose the Right One for Traders
Differences between technical analysis in CFD vs. fundamental analysis
|
Criteria |
Technical Analysis |
Fundamental Analysis |
|
Focus |
Price charts |
Economic data |
|
Time frame |
Short to medium term |
Medium to long term |
|
Main tools |
Indicators, patterns |
Economic reports |
|
Suitable for |
Day traders, swing traders |
Position traders |
|
Difficulty |
Medium | High (requires understanding of economics) |
Key tools and methods in technical analysis in CFD
Price charts
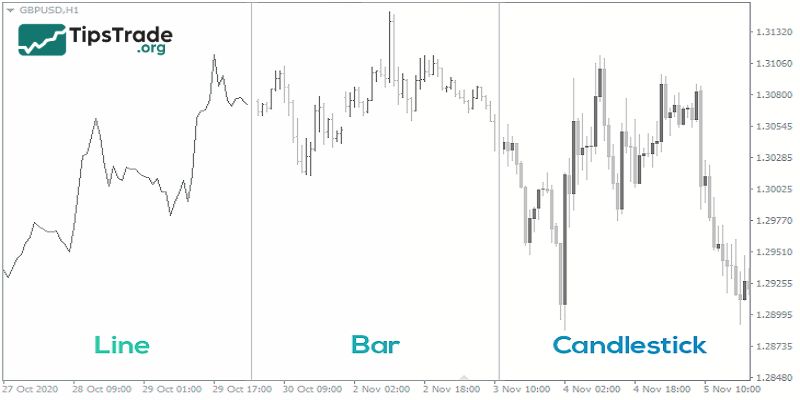
Charts are the “heart” of technical analysis. In CFD trading, there are three common types of charts:
- Line chart: Shows only the closing prices over time. It is simple and suitable for observing the overall trend.
- Candlestick chart: Displays the open, close, high, and low prices within a specific time period. This is the most widely used chart in CFD trading due to its detail and ease of analysis.
- Bar chart: Similar to candlestick charts but less popular in the CFD trading community.
Traders can customize the chart’s time frame (1 minute – M1, 1 hour – H1, 1 day – D1, etc.) to match their trading style.
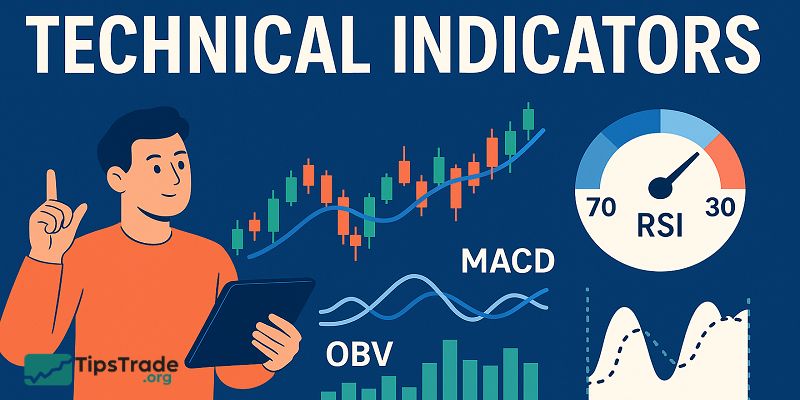
Technical indicators
Indicators are mathematical tools integrated into trading platforms like MetaTrader 4 (MT4) or MetaTrader 5 (MT5), helping traders analyze prices more easily:
- Moving Averages (MA): Includes SMA (Simple Moving Average) and EMA (Exponential Moving Average). MAs help smooth out price data to identify trends. For example, when the 50-period EMA crosses above the 200-period EMA, it is a buy signal (uptrend).
- RSI (Relative Strength Index): An index ranging from 0 to 100 that measures trend strength. An RSI above 70 indicates the market may be overbought, while below 30 suggests oversold conditions.
- MACD (Moving Average Convergence Divergence): Composed of the MACD line and the Signal line. When the MACD line crosses above the Signal line, it signals the start of an uptrend.
- Bollinger Bands: Consist of three lines (the middle line is an MA, the upper and lower lines are standard deviations). When the price touches the upper band, the market may reverse downward; touching the lower band may indicate a potential upward reversal.
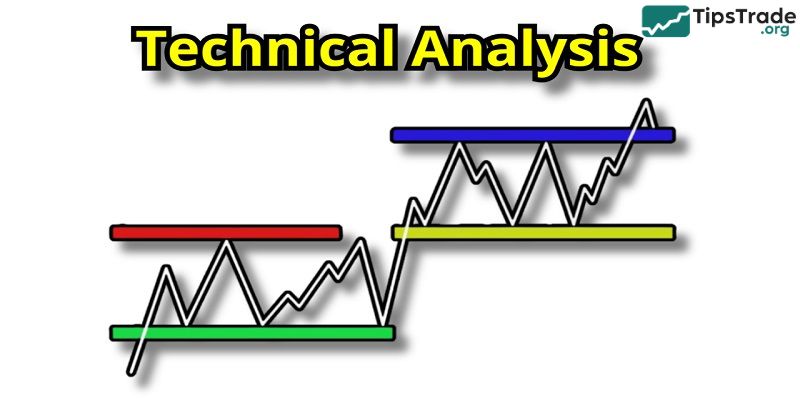
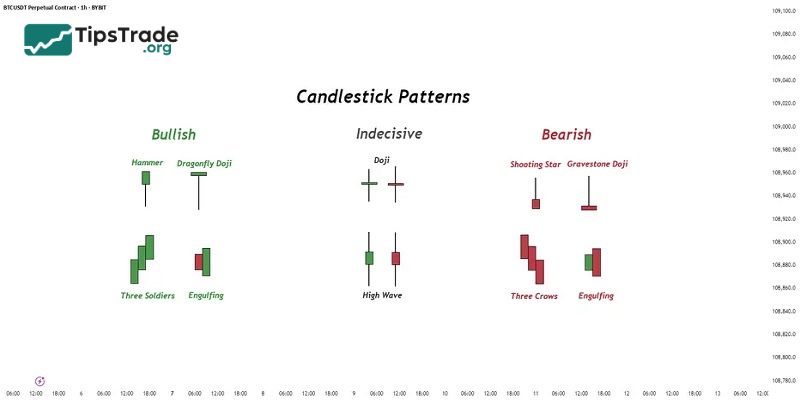
Price patterns
Price patterns are characteristic shapes on charts that help predict the next direction of price movement.
Bullish patterns:
- Inverse Head and Shoulders: Consists of three troughs (left shoulder, head, right shoulder), with the “head” being the lowest point. When the price breaks above the neckline, it signals the start of an uptrend.
- Bullish Flag: Appears after a strong upward move (the flagpole), followed by a consolidation phase (the flag). When the price breaks out of the flag, the uptrend continues.
Bearish patterns:
- Double Top: Price hits the same high twice (forming an “M” shape), then drops sharply when support (the neckline) is broken.
- Descending Triangle: Price forms lower highs with a flat bottom. A breakout below the bottom signals a strong downtrend.
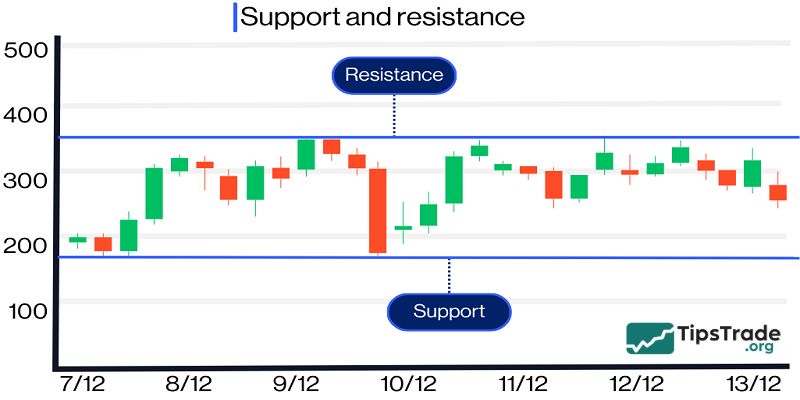
Support and resistance levels
- Support: A price zone where buying pressure is strong enough to prevent further decline. This is often where traders place buy orders or stop-losses when selling. For example, on the H4 chart of XAU/USD (gold), the 1800 USD support level held through three tests, indicating strong buying demand. Traders might buy when the price returns to 1805, with a stop-loss at 1795.
- Resistance: A price zone where selling pressure dominates, preventing the price from rising further. This is where traders place sell orders or take-profit levels when buying. For instance, on the D1 chart of USD/JPY, the 110.00 resistance level caused the price to drop three times. Traders could sell at 109.90 with a target of 109.00.
When support is broken, it can turn into a new resistance level, and vice versa. Traders often draw horizontal lines on charts to identify support and resistance levels, combining them with indicators or price patterns to increase the accuracy of trading signals.
Applications of technical analysis in CFD trading
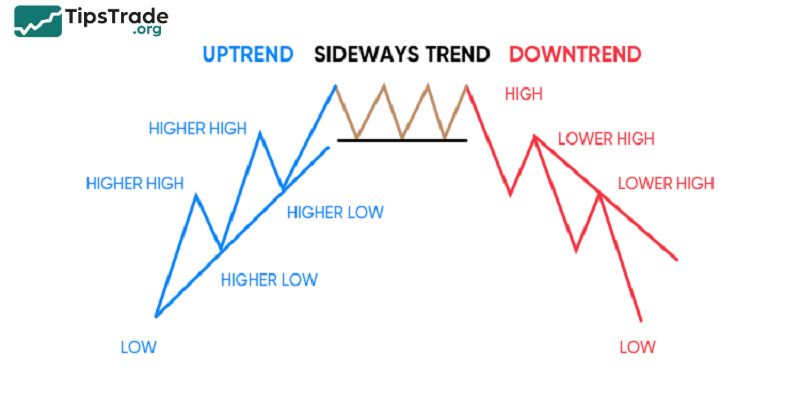
Identifying market trends
Technical analysis helps traders recognize price trends, including uptrends, downtrends, or sideways movements. Tools such as Moving Averages, Trendlines, or the Average Directional Index (ADX) are commonly used to determine the market’s direction. Understanding the trend allows traders to trade with the momentum, increasing the potential for profits.
Finding entry and exit points
Technical analysis provides specific signals to determine when to buy or sell. For example:
- Price patterns: Patterns like Head and Shoulders, Triangles, or Flags help predict trend reversals or continuations.
- Support and resistance levels: These are price zones where the price often bounces or breaks, helping traders place buy orders at support and sell orders at resistance.
- Technical indicators: RSI, MACD, or Stochastic Oscillator assist in identifying overbought or oversold conditions, helping find optimal entry points.
Risk management
Technical analysis not only helps identify trading opportunities but also supports effective risk management. By using stop-loss levels based on support/resistance or the ATR (Average True Range) to measure price volatility, traders can limit losses and protect capital. Risk/reward ratios are often calculated based on key price levels identified through technical analysis.

Predicting short-term price movements
The CFD market is constantly changing, especially in short time frames. Technical analysis is very useful for swing traders or day traders. Tools like candlestick charts provide fast signals about potential price reversals or continuations.
Integration with trading strategies
Technical analysis can be incorporated into a wide range of trading strategies, from news trading to algorithmic trading. For example, a trader may use the Bollinger Bands indicator to identify price volatility following the release of economic news, thereby taking advantage of potential price breakouts.

Market sentiment analysis
Price and trading volume data used in technical analysis reflect the behavior of market participants. By observing chart patterns or indicators such as OBV (On-Balance Volume), traders can gain insights into crowd psychology, whether the market is being driven by fear or greed, and make more informed trading decisions accordingly.
Advantages and disadvantages of technical analysis in CFD trading
Advantages of technical analysis in CFD trading
- Easy to access and apply: Technical analysis in CFD does not require in-depth knowledge of macroeconomics or finance as fundamental analysis does. Anyone can learn how to read charts, identify price patterns, and use basic technical indicators. Tools such as Moving Averages, RSI, and MACD are readily available on popular trading platforms like MetaTrader and TradingView.
- Suitable for all timeframes: Technical analysis in CFD can be applied to both short-term and long-term trading. Traders can tailor their strategies according to their chosen timeframe, ranging from a few minutes to several months.
- Focus on price data: This method relies entirely on historical price and volume data, which are believed to reflect all available market information (according to Dow Theory). As a result, traders do not need to analyze too many external factors.
- Automation capability: Strategies based on technical analysis can be easily programmed into trading robots or algorithms, making them well-suited to the growing trend of automated trading.

Disadvantages of technical analysis in CFD trading
- Inability to predict the impact of unexpected news: Technical analysis in CFD mainly relies on historical data and cannot accurately anticipate market reactions to major events such as interest rate decisions, employment reports, natural disasters, or wars. These factors often trigger strong volatility, breaking established technical patterns.
- Risk of false signals: Technical indicators such as RSI or MACD can generate misleading signals, especially in low-volatility or sideways markets. This may result in inaccurate trading decisions.
- Reduced effectiveness in non-trending markets: When the market lacks a clear trend (sideways movement), many technical tools such as moving averages or price patterns become less effective, increasing the risk of losses.
- Dependence on historical data: Technical analysis in CFD assumes that past patterns will repeat themselves, but this is not always the case. Markets continuously evolve due to changes in technology, policies, and investor sentiment.
Conclusion
Through this article, we hope you now have a comprehensive understanding of what technical analysis in CFD trading is. Although it has certain limitations, technical analysis in CFD remains an essential tool in the toolkit of any trader. By flexibly combining various technical analysis tools and methods, along with implementing strict risk management, you can enhance your chances of success in the highly volatile financial markets.
See more: