
When entering the stock market, the support and resistance levels are one of the fundamental concepts that investors need to know. To invest effectively, you need to understand this term clearly, possess analytical skills, and have an effective strategy. So, what are the support and resistance levels in stock? Let’s take a look at the article below with Tipstrade.org!
What are support and resistance levels?
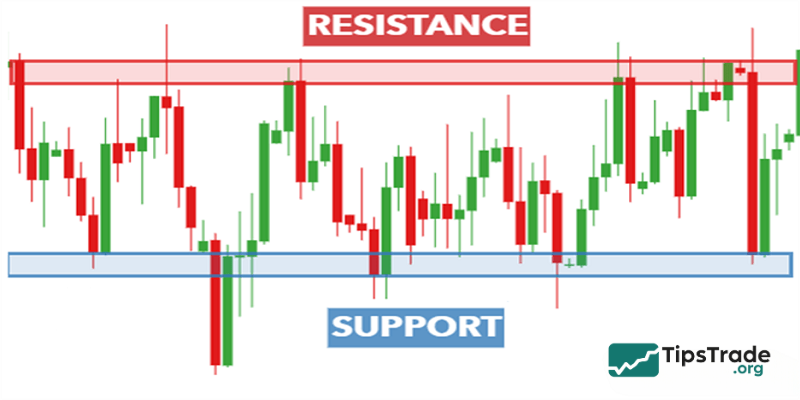
Support and resistance levels are terms that refer to price zones in the past, formed when the price reverses or slows down, creating peaks, troughs, or price trends in the subsequent stock market.
What is a support level?
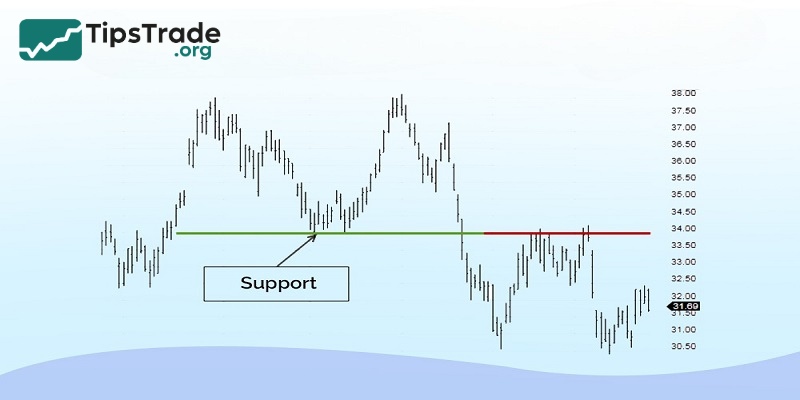
Support is a price zone where a downtrend is expected to reverse to the upside. In this zone, most investors will exercise more buying pressure than selling pressure.
When the price is adjusted down and is on an upward trend, the lowest price zone before continuing the upward trend is called the support zone. Investors need to rely on index analysis to determine the support zone, from which they can decide whether to buy stocks.
>>See more:
- Impact of Macroeconomic Factors on Stocks
- Basic Stock Indicators Investors Need To Know
- What is bid ask spread? Factors that influence bid ask spread
- Technical Analysis for Stocks: The Complete Guide for Modern Investors
What is a resistance level?
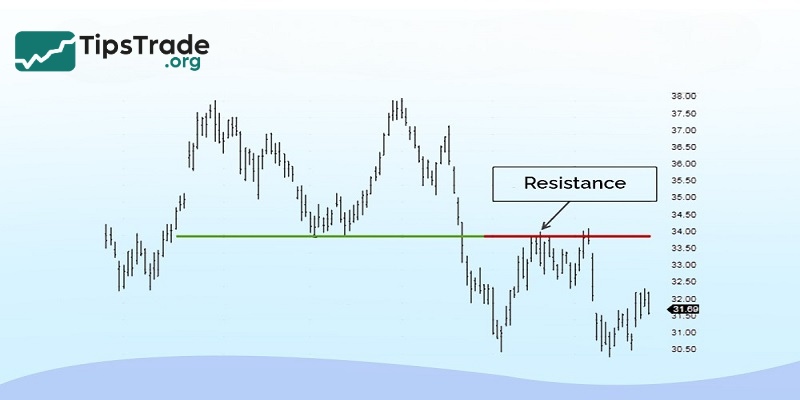
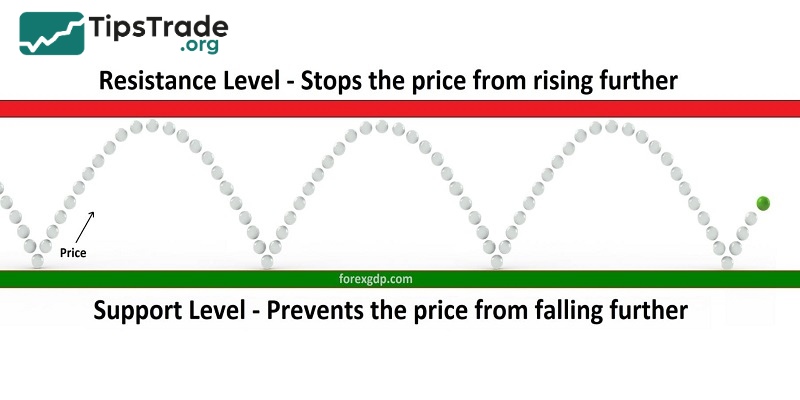
In contrast to support, resistance is a price zone where an uptrend is expected to reverse downward. This is also the price zone where investors expect prices to fall lower in stock trading.
At resistance, investors have more selling pressure than buying pressure. When prices are rising but are expected to fall, the highest price before the uptrend continues is identified as resistance.
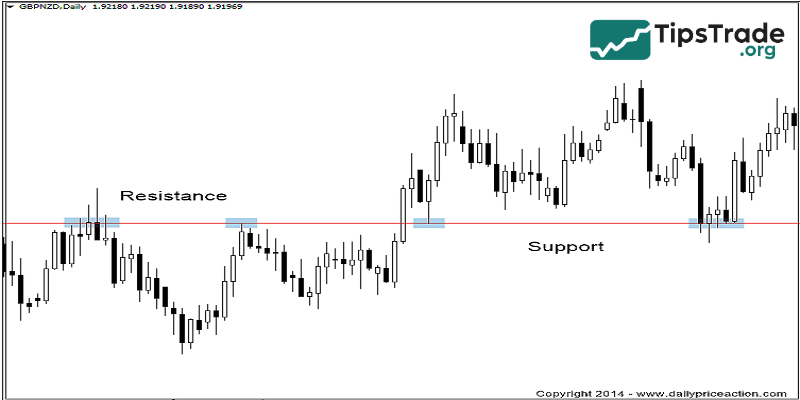
Distinguishing between support and resistance levels
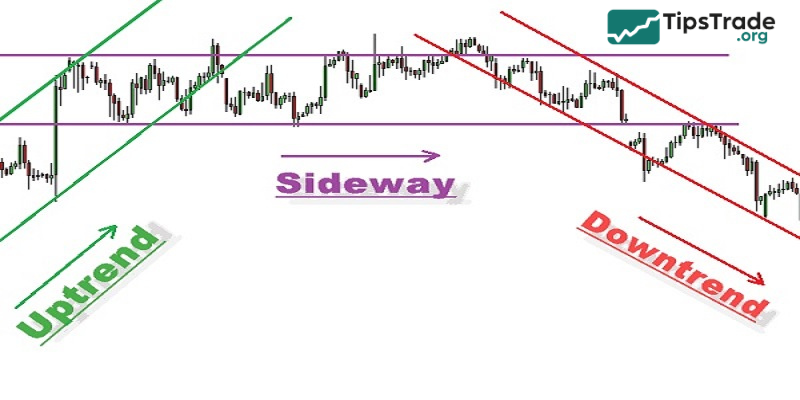
We can simply understand that, the support level will be the bottoms and the resistance level will be the peaks. In stock trading, prices fluctuate in a series of peaks and bottoms, so determining the support and resistance levels will help investors determine market trends, thereby executing timely trading orders.
With an uptrend, support and resistance levels will be created in an upward direction. And conversely, with a downtrend, support and resistance levels will reverse and trend downward.
One thing to note here is that if the support and resistance levels are broken, these two zones will change direction. That is, the support level will change to a resistance level and vice versa, the resistance level will change to a support level.
Why support and resistance levels matter
These are two important limits that many investors use when analyzing the stock market, directly affecting their trading decisions. Specifically, support and resistance levels:
- These are psychological milestones for participants, where people consider buying/selling decisions.
- It is the basis for investors to make effective decisions on exiting, stopping, and cutting losses. In fact, many investors who want to ensure capital safety will choose to comply with the principle of cutting losses within the limit.
- Support investors to determine appropriate entry orders to maximize profits. Experts rely on these two zones to determine the trend of future price fluctuations, thereby making more effective buy/sell decisions.

The factors that form support and resistance levels
In reality, support and resistance levels can change and fluctuate. So what are the factors that create these two zones?
Support and resistance levels are formed by two core elements:
– Market psychology:
- When stock prices rise, many investors tend to sell to take profits, making it difficult for prices to continue rising and creating a resistance zone.
- When stock prices fall sharply, many people buy in with the expectation that prices will recover, thereby forming a support zone.
- This happens because most investors act on the same market information and tend to place orders at similar prices.
– Past habits: Technical analysis relies on historical data and investors often remember past price peaks or troughs. When prices return to these peaks/troughs, they tend to repeat the same behavior because they believe the market will move and produce similar results as in the past.
Identifying support and resistance levels
How can you identify potential support or resistance zones? There are three ways you can do this:
Based on the current trading price range
To determine the support and resistance levels, investors can observe based on the current trading price zone. Because this is the zone that approaches the price level the fastest, when the price fluctuates up and down many times, in cycles, continuously repeating, this is the potential price zone.
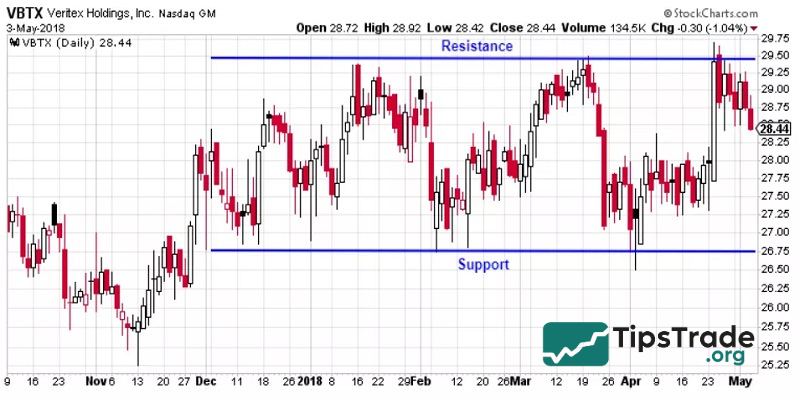
Please note, the longer the support and resistance price levels form, the more meaningful and accurate that price zone is. Specifically:
- Looking at a specific price range, at the peak, the distance between the highest price and the closing/opening price is the support zone. The more candles are formed in this range, the stronger the resistance zone, the next trend the price will hardly be able to break out of this zone.
- Looking at the bottom area, the distance between the lowest price to the closing/opening price is the resistance zone, the more candles are formed in this area, the harder it is for the price to fall through because the resistance zone is very strong.
Using the chart
If you cannot visualize and evaluate a support/resistance zone on a candlestick chart, consider switching to a line chart because they show high/low price points and connect them together. This makes it easier for investors to visualize, and it becomes easier to determine support and resistance zones based on price history.
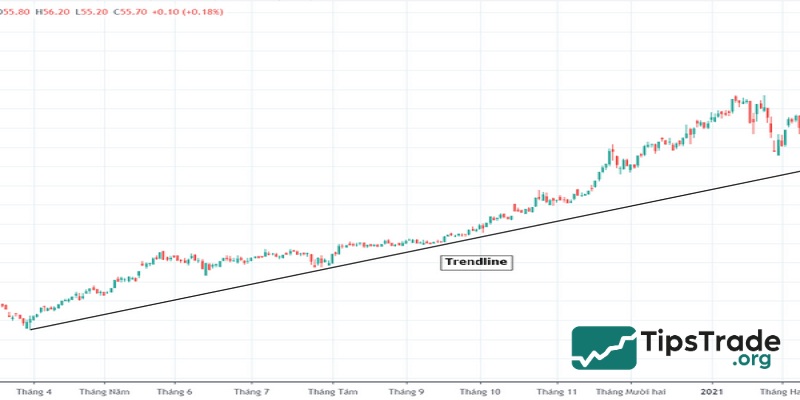
When analyzing in this way, investors often do the following: Connect the peaks/bottoms of prices over a period of time into a line. This line is the trend line that reflects the buying/selling pressure in the market as the price gets closer to this line.
- As the stock price tends to fall, the line connecting the price peaks over a specific period of time will reflect increased selling pressure as the price moves closer to the downtrend line (resistance line).
- On the contrary, the price is in an uptrend, connecting the bottoms to create an uptrend line (support line). When the price falls to the support line, the buying pressure in the market will increase.
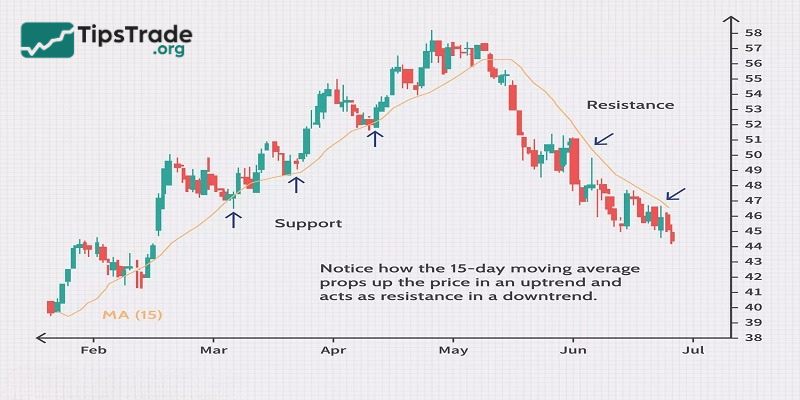
Using the moving average
In addition, people also use the average price line as a support/resistance line – the nature of this line helps to smooth out short-term price noise signals. When the price is below the average line, it will create resistance, and when the price is above the average line, it will create support.
- See more: What is MACD in stock market
How to draw support and resistance levels
First, to draw these two price points, we identify the stock price points.
To draw the resistance zone, we identify the price points where the stock peaked and declined; the peaks are quite close together; connecting these peaks with a straight line gives us the resistance price zone.
Similarly, to draw a resistance price zone, we identify the stock price points where it bottoms and recovers; the distances between the bottoms are quite close; connecting them with a straight line, we will determine the support price zone.
The further apart the bottoms, the price of the bottoms is almost the same and is connected from 3 or more bottoms; this is the medium and long-term support price zone, depending on the time distance. Similarly, we can also identify medium and long-term resistance price zones.
How to trade with support and resistance levels
To trade with support and resistance levels, investors can apply the method of trading when the price bounces back or trading when the price breaks out. Specifically:
Bounce strategy
This is a trading method that is based on waiting for the stock price to react after touching support or resistance levels. This way, we will ensure that the price has bounced back from these zones before proceeding with the next trade.
This method helps reduce the risk in case the stock price breaks the support or resistance levels. This is a safe approach for investors entering the market.
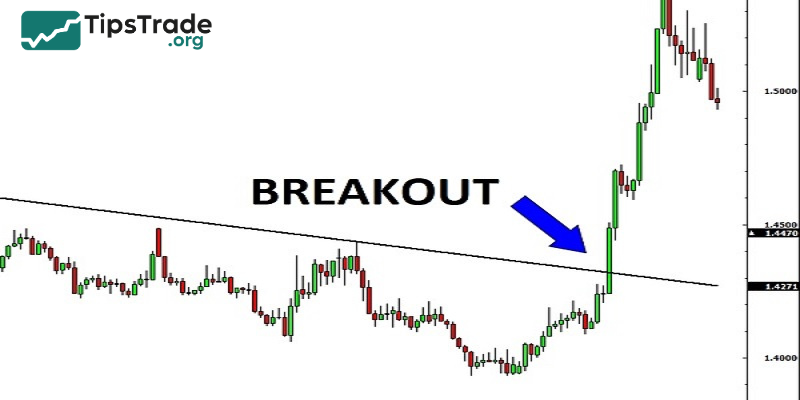
Breakout strategy
The thresholds in the support and resistance levels will often be broken. When the price breaks the transaction, investors will trade in 2 ways:
- Investors execute buy/sell orders as soon as the price breaks the support or resistance zone.
- Investors need to wait for the price to “recover” to the broken support or resistance zone and place an order when the price bounces back instead of immediately placing an order when the price breaks the support or resistance zone.
Notes when trading at support and resistance levels
Support and resistance levels help determine prices and determine effective order placement times. However, when using support and resistance levels in stock investment, you need to note the following:
- Orders must be placed right at the support and resistance levels, do not buy/sell too early.
- Investors must be patient and wait for reversal signals from these two zones. Being impatient with an unstable mentality will cause the order placement process to be at the wrong time, possibly resulting in losses or low profits.
- In case the support and resistance levels are broken and reversed, traders need to wait for the price to return to the broken support and resistance levels, then place orders. This will ensure a stable trading process and financial security for you.
Conclusion
Understanding support and resistance levels clearly, as well as grasping price fluctuation trends, which are the factors that cause zone changes, helps investors make sound decisions. Hopefully, the above sharing will help you effectively apply it to your trading process, thereby achieving your desired profits.