
Among Japanese candlestick patterns, there is a rather distinctive one known as the Spinning Top candlestick. This pattern reflects market indecision, where neither buyers nor sellers have a clear advantage. So, what is the Spinning Top candlestick? What are its characteristics, and how can it be traded? Let’s explore these questions in this article.
What is Spinning Top candlestick?
In technical analysis, the Spinning Top candlestick is one of the simplest but highly accurate candlestick patterns. This type of candle often appears when the market is fluctuating in either an uptrend or a downtrend.
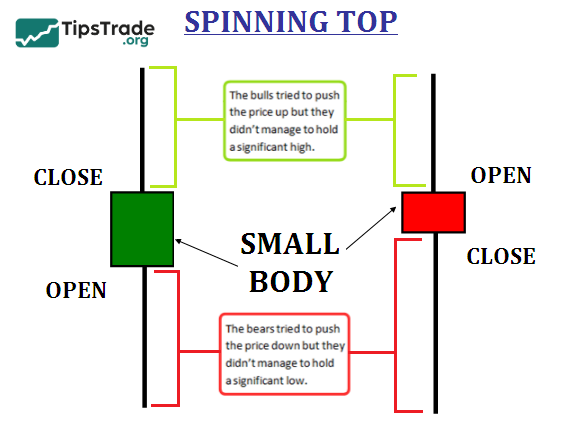
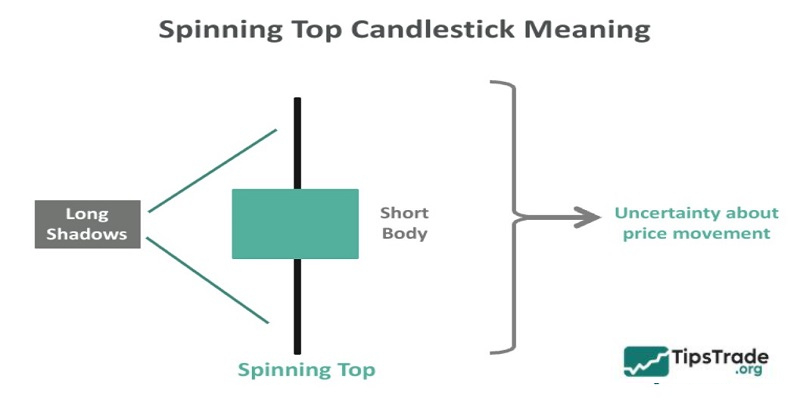
The Spinning Top candlestick pattern is easily recognizable by its small body with closing and opening prices that are almost equal, and long upper and lower shadows. This indicates a “tug-of-war” between buyers and sellers, resulting in a temporary balance or stalemate in the market.
See more:
- How to Use the Hammer Candlestick for the Most Effective Trading
- Shooting Star Candlestick Pattern: How to Identify and Trade It Effectively
- Marubozu Candlestick: A Detailed Guide to Identification and Effective Trading
- What is price action? A complete guide to price action trading from basics to advanced
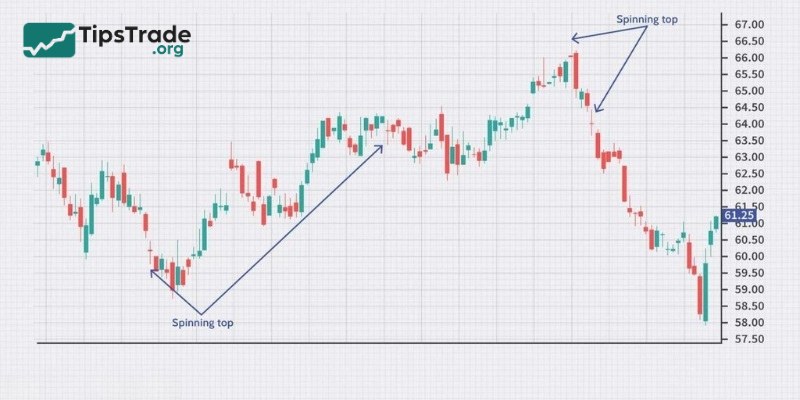
Types of Spinning Top candlesticks
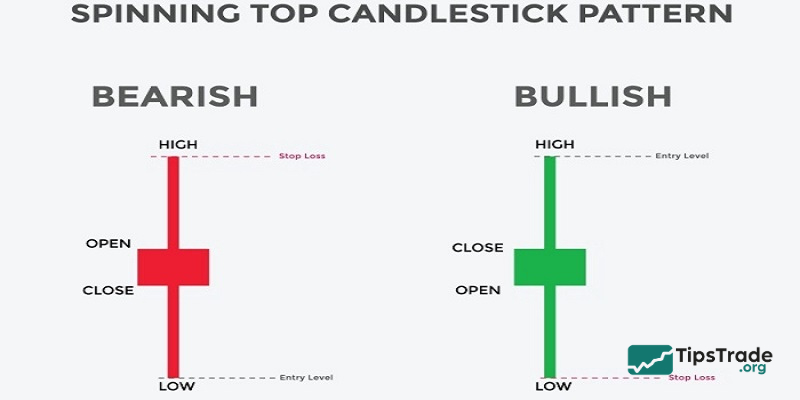
The Spinning Top candlestick can be divided into two main types: bullish Spinning Top and bearish Spinning Top:
- Bullish Spinning Top: This type of candle appears in a downtrend. The green (or white) real body indicates that buying pressure is starting to gain strength and a potential bullish reversal may occur. If it forms while price is creating a bottom near a support level, the signal becomes more reliable, and you may consider opening a buy position.
- Bearish Spinning Top: This type of candle typically appears in an uptrend and has a red (or black) real body, signaling increasing selling pressure. If it appears when the market is approaching or testing a resistance level, the signal tends to be more accurate. In this case, you may consider taking profits, selling, or reducing your stock exposure.
Characteristics of the Spinning Top candlestick
The Spinning Top candlestick can be identified by the following characteristics:
- Small real body: The distance between the opening and closing prices is very small, indicating that the price movement during the session is not strong enough to favor either buyers or sellers.
- Long wicks: Both the upper and lower shadows are long, showing that buyers or sellers were dominant at different moments during the trading session. However, by the close, a temporary balance was reached.
- Trading volume: Volume is usually not unusually high, reflecting a market that is in a pause and waiting for further signals.
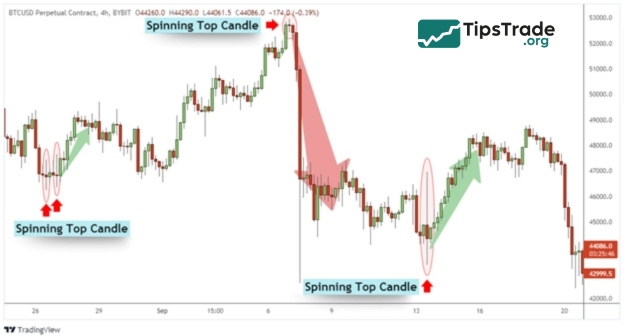
- Position within the trend: The Spinning Top often appears at the beginning or the end of an uptrend or downtrend. In a downtrend, it may signal a potential bullish move, while in an uptrend, it may indicate a possible bearish move.
Meaning of the Spinning Top candlestick in trading
The Spinning Top candlestick carries several important meanings, helping investors interpret market psychology and make more informed trading decisions:
- Market indecision: This type of candle reflects hesitation from both buyers and sellers. When it appears, the market is in a temporary state of balance, with neither side clearly in control.
- Potential reversal signal: If it appears in a downtrend, the Spinning Top may indicate that buying pressure is returning and prices could move higher. Conversely, when it forms in an uptrend, it may signal that selling pressure is about to increase. However, the reversal signal is not very strong on its own.
- A warning to be cautious: The appearance of a Spinning Top suggests that traders should observe the market more closely, as price action is indecisive and the trend has not been clearly defined. It is advisable to wait for confirmation from subsequent trading sessions before making any trading decisions.
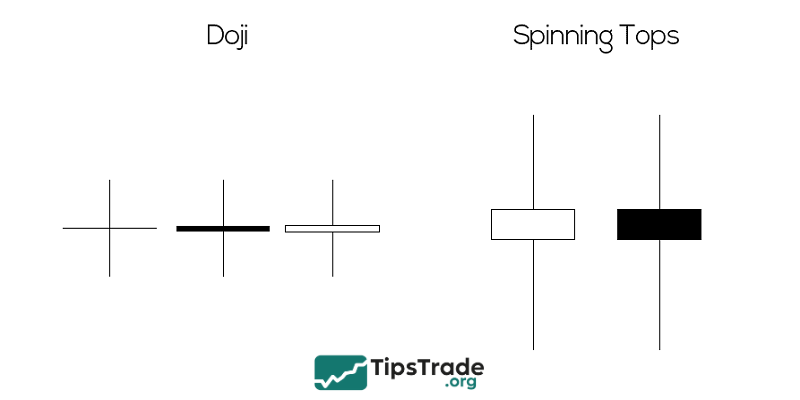
The Difference Between a Spinning Top and a Doji
Both Spinning Top and Doji candles are candlestick patterns that signal market indecision, but they differ in structure and meaning.
- Doji candlestick: It has a very small or nonexistent real body, meaning the opening and closing prices are equal or nearly equal. In contrast, the Spinning Top has a small but visible real body, indicating a slight difference between the opening and closing prices.
- Signal strength: A Doji is often considered a strong reversal signal, reflecting a significant shift in market sentiment. Meanwhile, the Spinning Top is a neutral signal, representing market indecision rather than a clear reversal.
How to trade the Spinning Top candlestick effectively
Since the Spinning Top candle does not provide a clear signal to enter a trade, you need to combine it with other analysis tools or wait for confirmation from the following candles to determine the trend before making a trading decision. Below are some basic steps to effectively trade with the Spinning Top candle:
Step 1: Identify the Spinning Top
You need to observe the price chart and look for candles with small bodies located in the center, along with two long and equal wicks. These are Spinning Top candles. You should also pay attention to the color of the candles, green or red, to understand the short-term trend of the market.
Step 2: Analyze the overall market trend
You need to determine the overall trend of the market before the appearance of a Spinning Top candle. You can use tools such as Moving Averages, Trendlines, Price Channels, or other candlestick patterns to identify the trend. If the market is in an uptrend or downtrend, a Spinning Top candle can be a signal of reversal or continuation. If the market is in a sideways trend, a Spinning Top candle can be a signal of continuation or reversal.
Step 3: Confirm with other indicators
You need to confirm the signal of the Spinning Top candle with other indicators to increase the reliability of your trading decision. You can use indicators such as RSI, MACD, Stochastic, Bollinger Bands, Parabolic SAR, Ichimoku, or other indicators depending on your trading style. You should choose indicators that complement each other and avoid using too many indicators of the same type to prevent confusion.
Step 4: Determine your entry and exit points
After confirming the signal of the Spinning Top candle, you need to determine your entry and exit points. You can use methods such as setting stop-loss orders, take-profit orders, using moving averages, trend lines, price channels, support and resistance levels, or other methods depending on your trading style. You should identify your entry and exit points before entering a trade to avoid being influenced by emotions during the trading process.
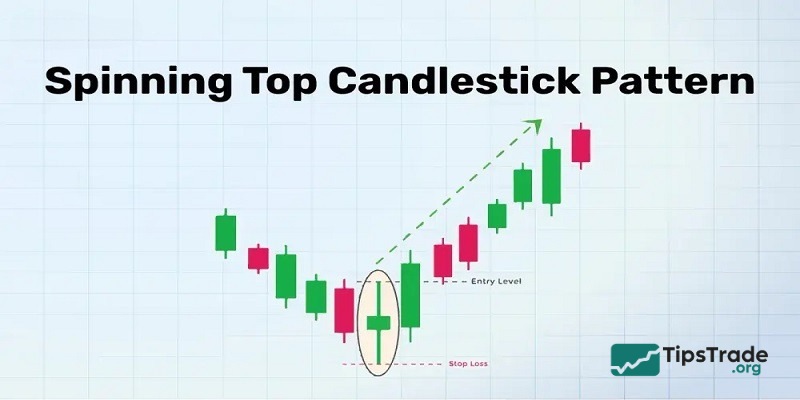
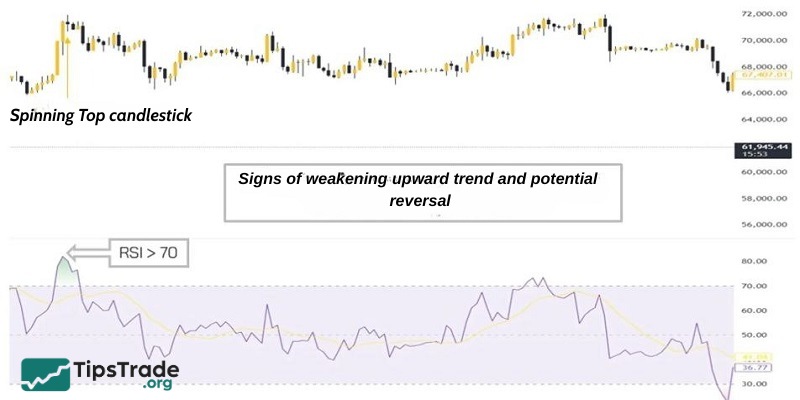
Specific example of Spinning Top in trading
In this example, we can see that the market is in an uptrend before the appearance of a green Spinning Top candlestick. This candle reflects market indecision, where neither buyers nor sellers have a clear advantage. It may signal either a potential reversal or a continuation of the uptrend.
To confirm this signal, we can use the RSI indicator to measure the strength of the trend. The RSI is above the 50 level, indicating that the uptrend is still relatively strong. However, the RSI is also trending downward, suggesting that buying pressure is weakening. This can serve as a warning sign of a possible upcoming reversal. Therefore, we should wait for confirmation from subsequent candles.
After the Spinning Top, a large bearish candle appears, showing that sellers have taken control and pushed prices lower. This acts as a confirmation of a trend reversal. We can enter a sell position immediately after this bearish candle closes, or wait for another confirmation candle for a more conservative approach. A stop-loss can be placed at the high of the Spinning Top, while the take-profit can be set at the low of the large bearish candle or at a nearby support level. In this way, we can capture a significant portion of the newly formed downtrend.
Pros and cons of the Spinning Top candlestick pattern
Each candlestick pattern has its own advantages and disadvantages. For the Spinning Top candlestick, they can be outlined as follows:
Pros of the Spinning Top candlestick pattern
- The Spinning Top is an easy-to-identify candlestick pattern on a price chart, with a distinctive shape resembling a spinning top.
- The Spinning Top reflects market indecision, where neither buyers nor sellers have control. This is an important signal for detecting potential market movements, especially when price is near key levels such as support, resistance, trendlines, price channels, and so on.
- The Spinning Top can be combined with other analysis tools such as technical indicators, moving averages, and other candlestick patterns to improve signal reliability and identify potential trade entry points.
Cons of the Spinning Top candlestick pattern
- The Spinning Top is a neutral candlestick pattern and does not provide a clear standalone trading signal. Traders need to wait for confirmation from subsequent candles or use additional technical analysis tools to determine market direction.
- Spinning Top candles may appear frequently on price charts, but not all of them are meaningful. Traders should pay close attention to market context (such as the overall trend, trading volume, and key price levels) to filter out the Spinning Top patterns that truly matter.
Conclusion
Once you have identified the Spinning Top candlestick pattern, you are getting closer to trading success. However, like any trading tool, there are its own advantages and disadvantages. Traders should carefully consider and master themselves before making investment decisions.