
Sideways trend is a market condition characterized by prices moving within a narrow horizontal range without a clear upward or downward direction. This trend occurs when supply and demand forces are nearly balanced, resulting in price fluctuations between defined support and resistance levels. The sideways trend often represents a period of consolidation or indecision in the market before a potential breakout or breakdown occurs. Visit tipstrade.org and check out the article below for further information
What Is a Sideways Trend?
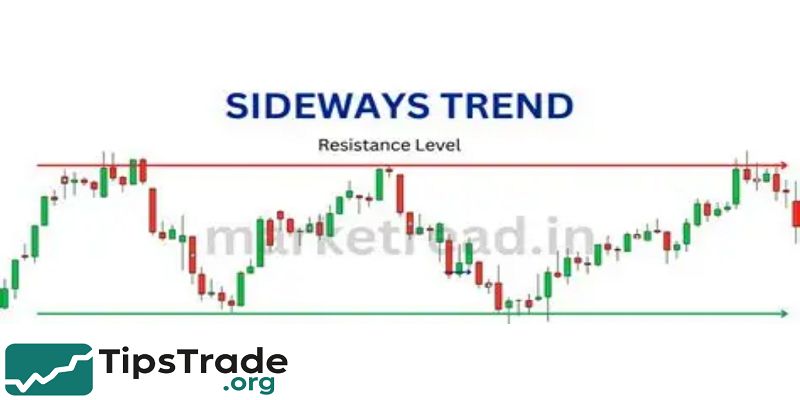
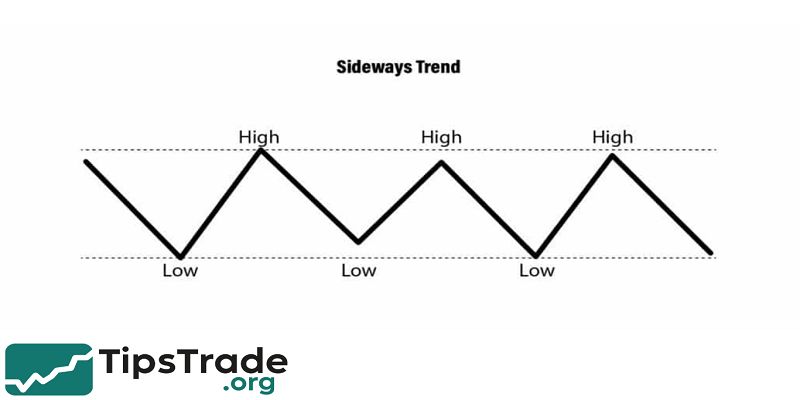
A sideways trend is a market condition where price fluctuates inside a horizontal channel. The support level forms the bottom of the range, and the resistance level creates the top.
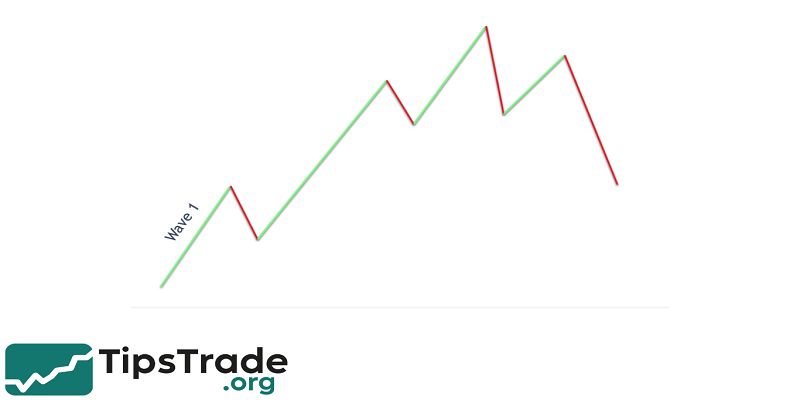
Instead of trending up (higher highs, higher lows) or trending down (lower highs, lower lows), the market moves sideways because supply and demand are nearly equal. The structure can last for hours, days, or even months.
In technical analysis, this is called consolidation — a phase where big players accumulate or distribute assets quietly.
Sideways trends often occur after strong moves. For example, when Bitcoin pumps rapidly, traders take profit, volume slows down, and price starts moving sideways. The same happens in stock markets when investors wait for new macroeconomic data or earnings reports. In forex, sideways conditions appear ahead of central bank meetings because traders avoid large positions.
A sideways trend does not mean “nothing is happening.” In many cases, large investors build positions here.
When volume suddenly increases and price breaks out of the range, the next trend becomes powerful.
That is why experienced traders observe sideways zones carefully. Entering too early causes losses, but entering after confirmation can bring high reward with controlled risk.
Key Characteristics of a Sideways Trend
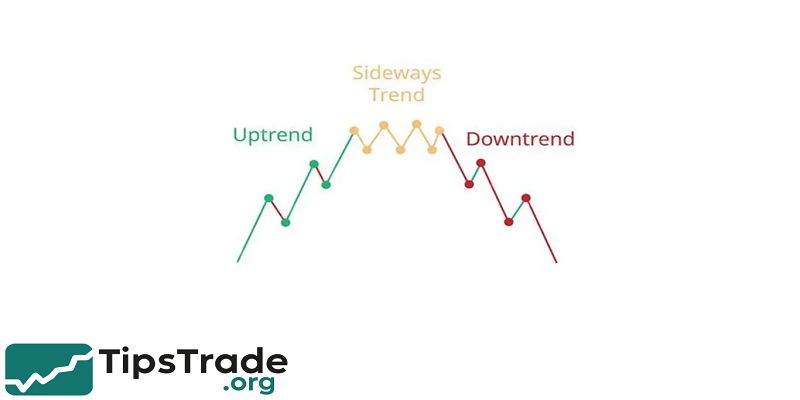
A sideways market has unique behavior that differentiates it from uptrend and downtrend. These characteristics help identify whether the market is ranging or simply pulling back temporarily.
Price Stays Between Support and Resistance
- In a sideways trend, price repeatedly rejects the same high and the same low. The support zone acts like a floor.
- When price touches support, buyers step in and push it back up. The resistance zone works like a ceiling. Every time price approaches resistance, sellers enter the market and push it down. The movement becomes a ping-pong pattern.
- Unlike an uptrend, price does not make higher highs. Unlike a downtrend, price does not make lower lows. The more times price touches these zones, the stronger they become.
- For example, if Bitcoin keeps bouncing between $38,000 and $41,000 for three weeks, that is a clear sideways structure. Traders use these boundaries to plan entries and exits.
Low Volatility and Low Volume
- Sideways trends are usually quiet. Volatility shrinks because neither buyers nor sellers dominate. Trading volume decreases because big players are waiting, not aggressively buying or dumping.
- According to data from Coinbase and Nasdaq reports, trading volume in consolidation phases typically drops 25–40% compared to trending phases.
- Low volatility makes it harder for momentum traders but easier for range scalpers.
For example, when the S&P 500 pauses ahead of a Federal Reserve announcement, price movement becomes narrow. Retail traders feel bored and exit the market, while institutional traders patiently wait for a breakout. When news arrives, volume spikes and a new trend finally begins.
False Breakouts (Fake Signals)
One of the biggest dangers of sideways markets is the fake breakout. Price suddenly jumps above resistance or falls below support — but without strong volume. New traders think the trend has started and enter too early. Suddenly, price reverses, trapping them. This is common in crypto due to market manipulation and low liquidity periods.
Experienced traders avoid entering unless:
- price closes clearly outside the range,
- volume expands,
- or retest confirms the breakout.
Without these confirmations, the probability of a trap is high.
Technical Indicators to Identify a Sideways Trend
Indicators make sideways trends easier to detect, especially for beginners who struggle to “read” naked charts. While no tool is perfect, a combination of simple indicators provides high-confidence signals.
Moving Averages (MA / EMA)
- In trending markets, moving averages slope clearly up or down. However, in sideways conditions, the MA becomes flat.
- Price oscillates around the line instead of staying above (bullish) or below (bearish). Many traders use the 20-period or 50-period MA on a 4H or 1D chart to identify trends.
- When the MA flattens and price crosses above and below repeatedly, momentum is gone and the trend has paused.
- This works in stocks, forex, and crypto. On a Bitcoin daily chart, for example, long sideways zones show price hugging the MA ribbon.
- Trend-following traders wait until MA angles upward or downward again before entering positions.
RSI (Relative Strength Index)
- RSI is a momentum oscillator that identifies strength or weakness. In a bullish trend, RSI stays above 50. In a bearish trend, it stays below 50.
- But in a sideways trend, RSI hovers around 50, rarely reaching overbought (70) or oversold (30). When RSI is stuck in the middle, momentum is neutral.
- Some traders use RSI swings to buy at support (RSI near 40) and sell near resistance (RSI around 60).
- Backtesting on forex pairs like EUR/USD or USD/JPY shows RSI mid-range behavior during consolidation zones.
Bollinger Bands
- Bollinger Bands measure volatility. When bands squeeze tightly, volatility is low — a strong sign of consolidation.
- A Bollinger squeeze often precedes a breakout. Traders watch for band expansion with high volume to detect the next trend direction.
For example, Tesla stock frequently squeezes on Bollinger Bands before earnings. After the report, volatility explodes and price breaks out of the range. Bollinger Bands help traders predict when “something big” is coming.
Best Trading Strategies for Sideways Markets
Even though sideways markets look boring, they offer opportunities. Scalpers and range traders enjoy these conditions because price respects boundaries. However, discipline and risk management are essential.
Range Trading (Buy Low, Sell High)
Range trading is the simplest method. Traders buy near support and sell near resistance. Stop-loss usually sits below support to protect against a breakout. This strategy works best when the support/resistance zones are tested multiple times.
Example:
- Price supports at $1,200 on gold
- Resistance at $1,230
- RSI sits around 45–60
- Volume low, no news catalyst
A trader enters long near $1,203 and sells near $1,228. Profit is small, but probability is high.
Benefits:
- Clear entries and exits
- Low risk when using tight stop-loss
- Works well in forex and blue-chip stocks
Risks:
- Profit smaller than trending markets
- Fake breakout can hit stop-loss
Scalping and Swing Strategies
- Short-term traders use smaller timeframes like M5, M15, or M30. They take multiple small trades inside the range.
- Indicators like RSI, Stochastic, and VWAP help filter entries.
- Scalping works well on high-liquidity assets such as EUR/USD, gold, and top crypto coins.
Breakout Strategy
Breakouts deliver the highest reward. Traders wait for price to close above resistance or below support. Confirmation steps include:
- Strong volume
- Retest of broken zone
- Price forming higher high / lower low outside the range
For example, Bitcoin consolidates at $30,000–$31,500 for two weeks. Suddenly volume rises 80% on Coinbase, and price closes above $31,500. That triggers long entries. If price retests $31,500 and holds, probability of trend continuation increases.
This strategy requires patience but avoids unnecessary losses.
Pros and Cons of Trading a Sideways Trend
| Item | Advantages | Disadvantages |
| Volatility | Low volatility → low risk entries | Slow market → small profits |
| Predictability | Price respects levels → easier planning | Levels can fail unexpectedly |
| Difficulty | Good for beginners learning charts | Hard for momentum-based traders |
| Profit Style | Many small wins | Rare big wins |
Sideways trends are great for learning price action. However, traders must avoid overtrading. Many lose money because they get impatient and chase breakouts without confirmation.
When Does a Sideways Trend End?
A sideways market ends when supply and demand stop balancing. News, earnings reports, economic data, or whale accumulation can suddenly push price into a new trend. To identify trend transition, traders watch for:
- Volume spike
- Breakout candle closing outside range
- Retest holding
- Momentum indicators showing new direction
- Moving averages sloping up or down again
A sideways trend can end in an uptrend (bullish breakout) or a downtrend (bearish breakdown). The key is waiting for confirmation. Backtesting shows that breakouts with strong volume have a much higher success rate than breakouts with low volume.
Conclusion
A sideways trend indicates a period where the market lacks a definitive direction, with prices oscillating between support and resistance levels. Understanding this trend is crucial for traders as it signals market indecision and potential opportunities when a breakout eventually happens. Recognizing the sideways trend helps investors manage risk and position themselves effectively for upcoming market movements.