
To succeed in Forex trading, accurately determining the right time to buy and sell is extremely important. Traders often use supporting tools to make effective trading decisions, and the RSI Forex technical indicator is one of them. So, what is the RSI Forex indicator? Let’s explore it together with Tipstrade.org!
What is RSI Forex?
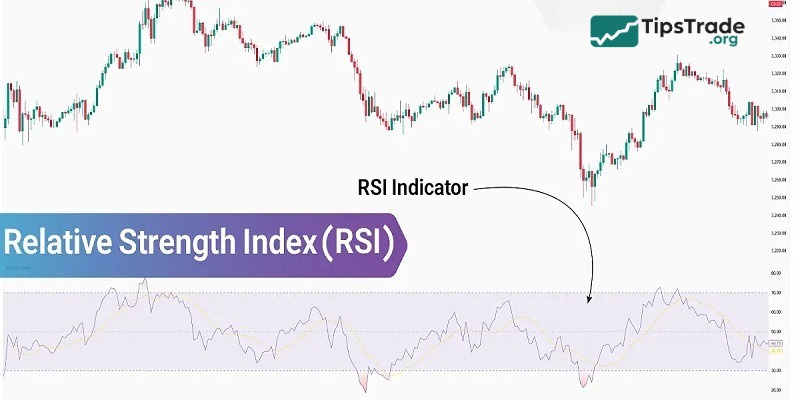
The RSI Forex indicator (Relative Strength Index) is a momentum indicator that measures the magnitude of recent price changes to evaluate overbought or oversold conditions in the foreign exchange market. The RSI Forex indicator is displayed as an oscillator, which is a line chart that moves between two boundary levels and is measured on a scale from 0 to 100.
The RSI was developed by J. Welles Wilder and introduced in the book New Concepts in Technical Trading Systems published in 1978, as well as in the June 1978 issue of Modern Trader magazine (now known as Futures magazine). RSI signals are not only valuable for the Forex market but also for most other financial markets such as Futures, Stocks,…making it one of the most widely used technical analysis indicators today.
See more:
- Compare MACD vs RSI: Which Indicator is Better?
- How to Use the Momentum Indicator when Trading
- The Ichimoku Indicator: What It Means and How to Use It
- Bollinger Bands – An effective technical indicator for investment trading!
The meaning of RSI Forex indicator in trading
Understanding the nature of the RSI Forex indicator will help you use this tool more effectively. In theory, the RSI Forex indicator shows when the market is overbought (meaning prices have risen too much) or oversold (meaning prices have fallen too much), and it provides signals indicating when a market trend may potentially reverse.
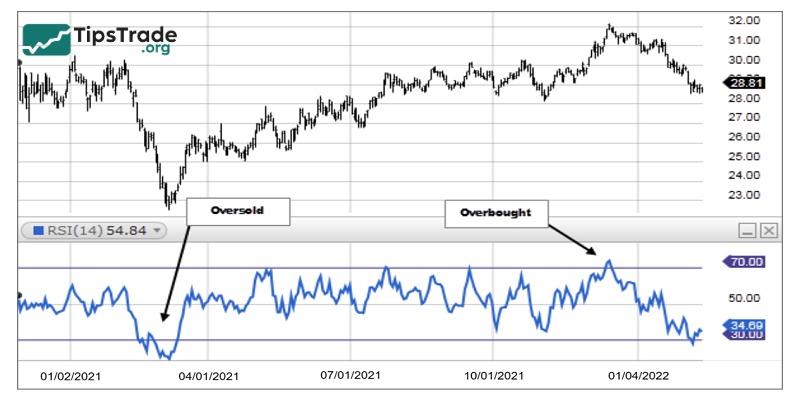
By using an averaging formula, Wilder was able to eliminate much of the randomness that may occur when observing individual trading days. The RSI Forex indicator is most commonly used with a 14-period setting, and its values are standardized on a scale from 0 to 100, with the standard boundary lines typically drawn at 30 and 70.
You can also adjust the period to be longer or shorter, depending on whether you want to evaluate the market outlook in the long term or short term.
If desired, you may also use overbought and oversold levels of 80-20 or even 90-10 (which are quite rare) instead of the default 70-30 levels. The closer the overbought and oversold levels are set to the extreme boundaries (0 and 100), the less frequently they will occur, but they will represent stronger market momentum.
Formula for calculating RSI Forex indicator
We have the formula for calculating the RSI Forex indicator as shown below:

Looking at the RSI formula above, you may wonder what RS is. RS stands for Relative Strength, and it is calculated as follows:
RS = Relative Strength = Average Gain / Average Loss
The default setting of RSI is 14 periods. First, let’s look at how the RSI formula works with the 14-period setting. This is how the RS value is calculated:
RS = (14 EMA of the last 14 upward bars) / (14 EMA of the last 14 bars)
After determining the RS value, you can substitute it into the original formula. This will give you the current RSI value.
If you change the calculation to 20 periods, the second formula will become:
RS = (20 EMA of the last 20 upward bars) / (20 EMA of the last 20 bars)
Here, EMA refers to the Exponential Moving Average. You can further explore the EMA moving average system to better understand how this indicator works.
Basic signals of the RSI Forex indicator in trading
There are three basic signals provided by the RSI Forex indicator, which traders often rely on to perform analysis and develop trading plans.
Overbought
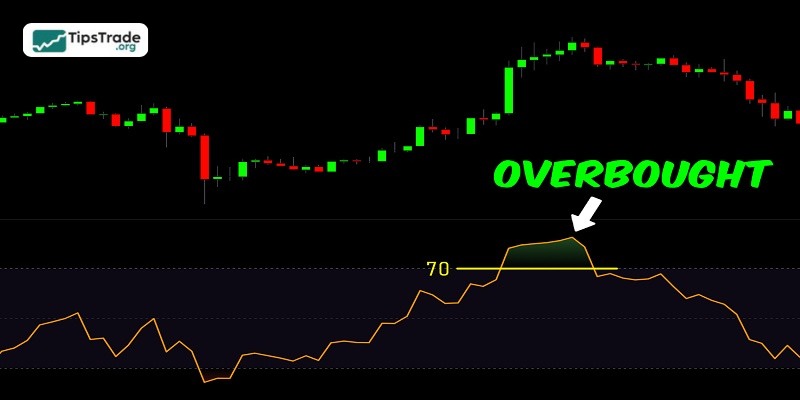
When the RSI Forex is above 70, it indicates that the market is overbought. This typically occurs during an uptrend and may signal that the market could reverse downward.
The RSI indicator gives an overbought signal when the RSI line enters the 70-100 zone. If you want to use a stronger overbought signal, you can adjust the level to 80-100 or even higher. However, while this makes the RSI signal stronger, overbought signals will appear much less frequently.
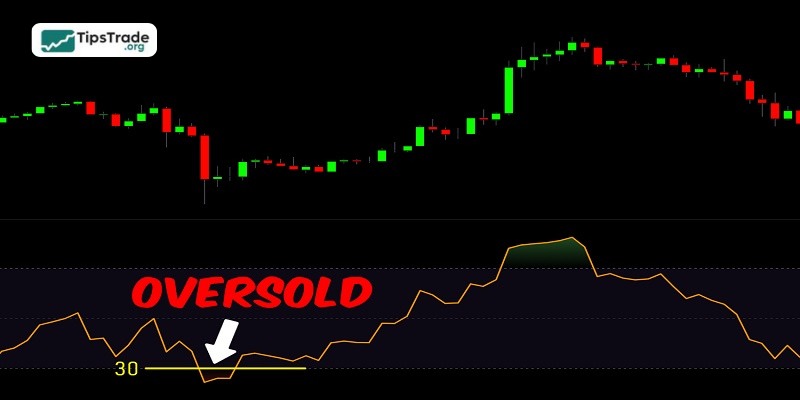
Oversold
When the RSI Forex falls below 30, it indicates that the market is oversold. This often occurs during a downtrend and may signal that the market could reverse upward.
The RSI indicator gives an oversold signal when the RSI line enters the 30-0 zone. If you want to identify stronger oversold conditions, you can use the 20-0 zone or even lower levels. This strengthens the RSI signal, but oversold signals will occur less frequently.
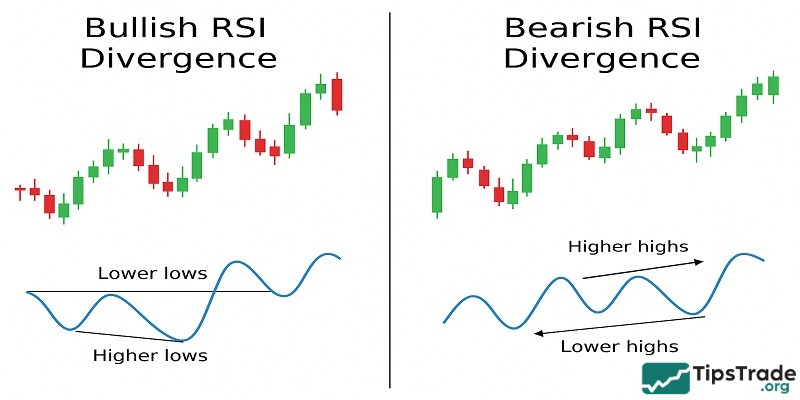
Divergence
Similar to other momentum indicators such as MACD or Stochastic, the RSI Forex indicator can move in the opposite direction of price action (a phenomenon known as divergence) to signal a potential market reversal.
- Bullish RSI divergence: The market forms a lower low, while the RSI line moves higher, indicating a potential bullish reversal.
- Bearish RSI divergence: The market forms a higher high, while the RSI line moves lower, indicating a potential bearish reversal.
Some notes when using the RSI Forex indicator
Many traders tend to become overly dependent on indicators, believing that “the indicator is always correct”. This mindset can be very dangerous because every trading indicator has its own meaning and limitations. You need to clearly understand how an indicator works in order to use it effectively. Below are two common mistakes traders may encounter:
- Mistake #1: Placing a BUY order when the market is oversold
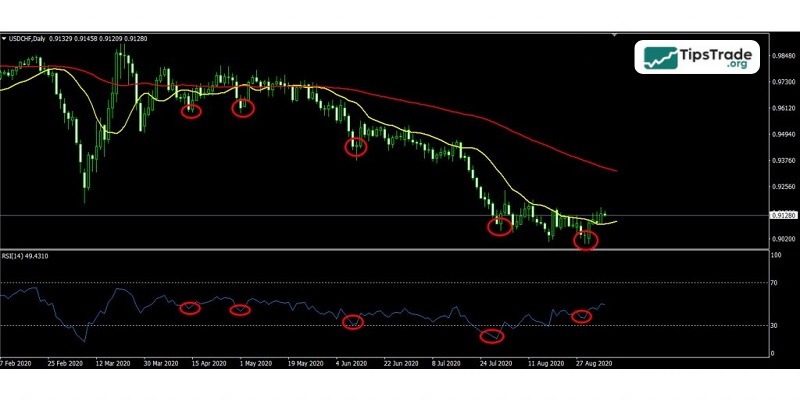
In the example above, you can see that the RSI Forex indicator enters the oversold zone, but it remains in that zone for a long period of time. During this time, the price continues to decline and repeatedly forms new lows that are lower than the previous ones.
If you rely solely on the oversold signal to place trades, you will frequently encounter this mistake, and the probability of successful trades will not be very high.
- Mistake #2: Placing a SELL order when the market is overbought
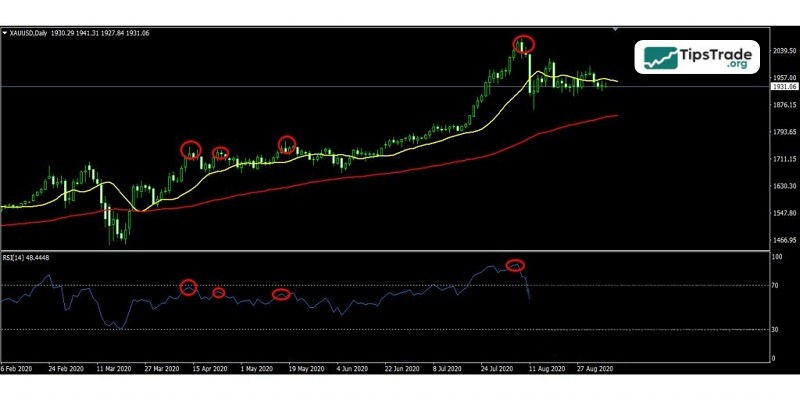
In this example, although the RSI Forex indicator does not remain in the overbought zone as in the previous case, the market still does not reverse. The RSI Forex indicator exits the overbought zone, but instead of reversing, the market only experiences a small pullback before continuing its previous trend.
Therefore, relying solely on the overbought signal is not sufficient to identify high-probability trading opportunities.
Basic ways to use the RSI Forex indicator
The most basic way to use RSI Forex indicator is to wait for the indicator to move above the 70 level, which indicates an overbought condition in the market, and then cross back below 70 to signal a potential sell opportunity. Conversely, traders can wait for the RSI Forex indicator to drop below the 30 level, indicating an oversold condition, and then cross back above 30 to signal a potential buy opportunity. To use RSI effectively, it is important to combine it with other trading tools.
In addition, there are several other ways to use the RSI Forex indicator, such as identifying divergence signals or combining the RSI Forex indicator with trendlines and support–resistance levels to improve trading analysis.
Conclusion
The RSI Forex is a useful technical indicator that helps traders in the foreign exchange market identify important market signals. By understanding how the RSI Forex indicator works and learning to apply it effectively, you can enhance your analytical skills and make smarter trading decisions. Wishing all traders great success in their trades!
See more: