
As an investor, you need to determine the appropriate entry and exit points. Let’s explore strong reversal patterns and predict future price trends through the following article!
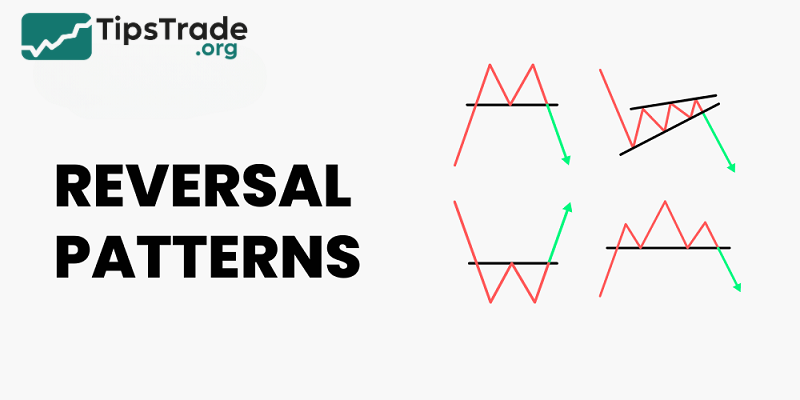
What are reversal patterns?
The reversal pattern is one of the effective and popular technical analysis tools. These reversal patterns are used to signal the upward or downward trend of prices at the time they occur. From the definition above, we can classify reversal patterns into bullish reversal patterns and bearish reversal patterns.
- A bullish reversal pattern will appear after a downtrend, signaling the end of the downtrend and the start of an uptrend.
- Conversely, a bearish reversal pattern appears after an uptrend and signals a downward price trend.
>>See more:
- Top 5 Most Common Continuation Patterns
- Mastering candlestick patterns for effective trading
- Basic price charts in trading and how to read each type
- Top 5 best technical indicators you shouldn’t miss
Types of bullish reversal patterns
Strong bullish reversal patterns signal that the price will reverse from a downtrend to an uptrend. Based on the signals from these bullish reversal patterns, investors seize the opportunity to buy. Here are some of the most common bullish reversal patterns:
Dragonfly Doji
The Dragonfly Doji candle is the most common candle pattern for a bullish reversal. This candlestick pattern has a rather unique shape, resembling a dragonfly with its wings spread. The Dragonfly Doji forms at the end of a downtrend, has a short or no body, a long lower shadow, and a short or no upper shadow.
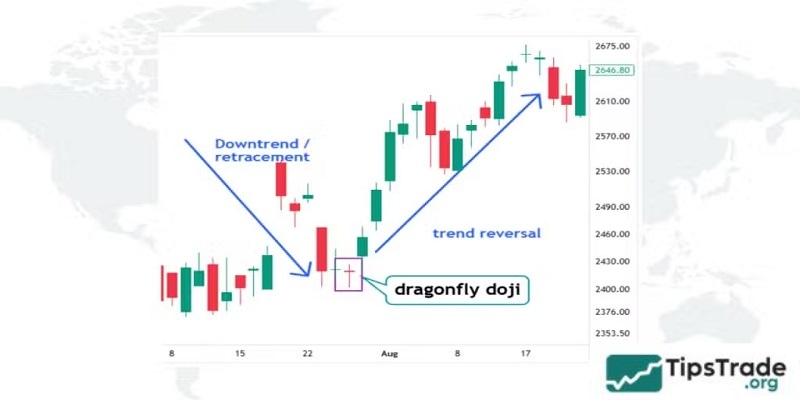
The Dragonfly Doji pattern predicts that in the early part of the session, sellers dominate and push the price down to an extremely low level. As soon as the price hits its lowest point, enormous buying pressure will be generated, the bulls will strengthen, pushing the price back up and closing as soon as the price reappears.
At this point, the closing price is also the highest price of the session, which is why the body of the candle is pushed upwards instead of being in the middle. When the Dragonfly Doji appears, it indicates that buyers have completely controlled subsequent trading sessions and the market is likely to reverse very strongly.
Bullish Engulfing
The Bullish Engulfing candlestick pattern consists of two candles: the first is a bearish candle, the second is a bullish candle, and the second candle completely engulfs the first.
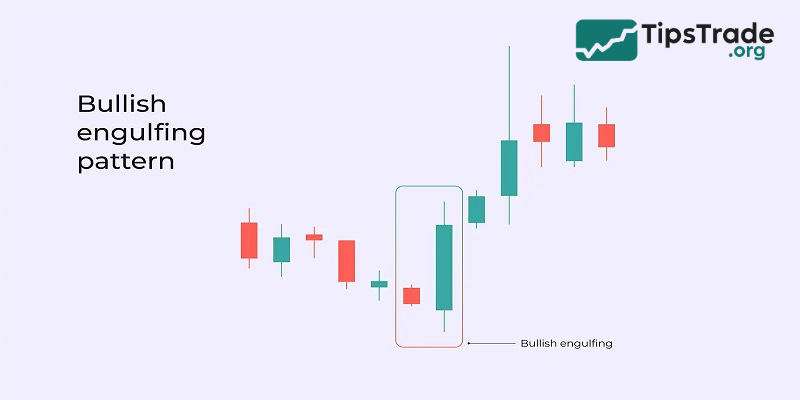
With this candlestick pattern, after a strong downtrend, a large green candle appears that engulfs the previous candle, making a trend reversal very understandable. The reversal signal will be even clearer if the first candle is a Doji.
The first candle shows the sellers are in control as they push the closing price lower than the opening price. However, strong buying pressure began and pushed the closing price higher than the first candle. The appearance of a Bullish Engulfing pattern indicates that buyers have regained the upper hand.
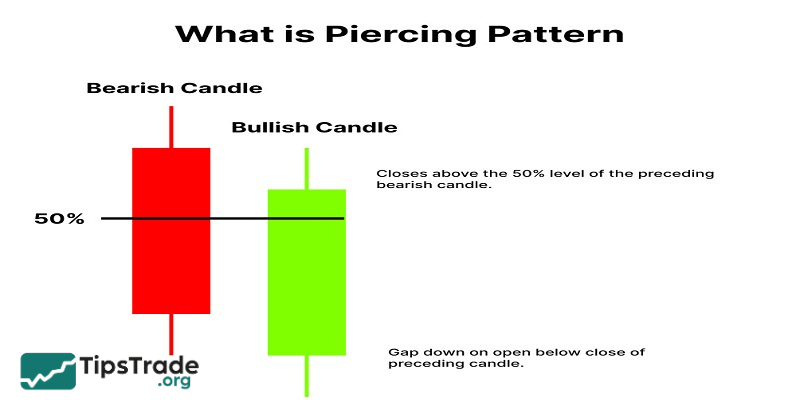
Piercing Pattern
The Piercing Pattern candlestick pattern also consists of two candles, where the first candle is a bearish candle and the second candle is a bullish candle. The length of the candle must increase by at least half compared to the candle before it. Additionally, the opening price of the bullish candle must create a certain gap with the closing price of the bearish candle.
A strong bullish candle appearing right after a sharp decline is a sign that buyers are trying to overwhelm sellers. If a bullish candle follows the Piercing Pattern, the likelihood of a reversal becomes even more pronounced.
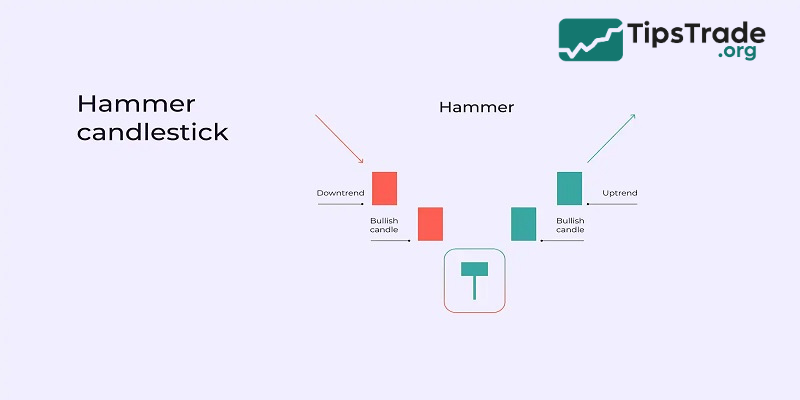
Hammer
When it comes to strong reversal patterns, the Hammer candlestick is definitely one you can’t miss. The Hammer candlestick pattern is shaped very similarly to a Doji, with a small body and a long lower shadow, while the upper shadow is short or almost non-existent.
This candle appears after a downtrend, indicating that buyers are gradually gaining control. When sellers try to push the price down, buyers resist and pull it back up.
The Hammer candle is most effective when there are three consecutive red candles in a downtrend, followed by a bullish candle after the Hammer.
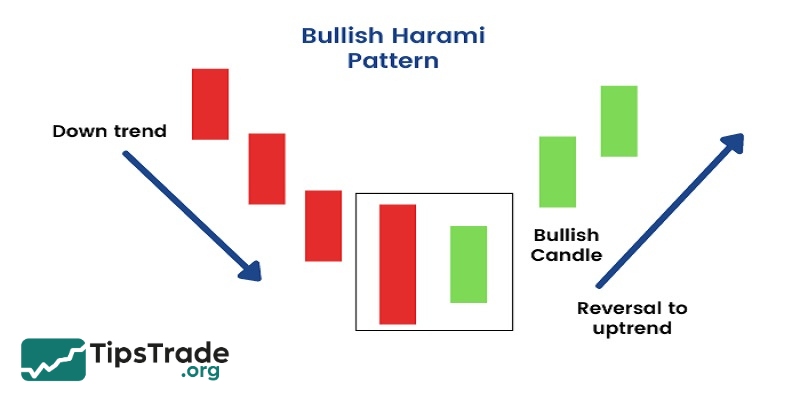
Bullish Harami
This pattern consists of two candles: the first candle is red and relatively large, while the second candle is blue and completely engulfs the first candle.
When the market is declining sharply, the appearance of a bullish candle indicates that the price doesn’t want to fall further, and buyers are gradually regaining the upper hand. However, it’s necessary to observe one more candle after the Bullish Harami ends to know if the price is truly reversing.
Morning Star
The Morning Star candlestick pattern consists of three candles: the first candle is strongly declining, the second candle has almost no body and resembles a Doji, Hammer, or Spinning Top, and the third candle is increasing.
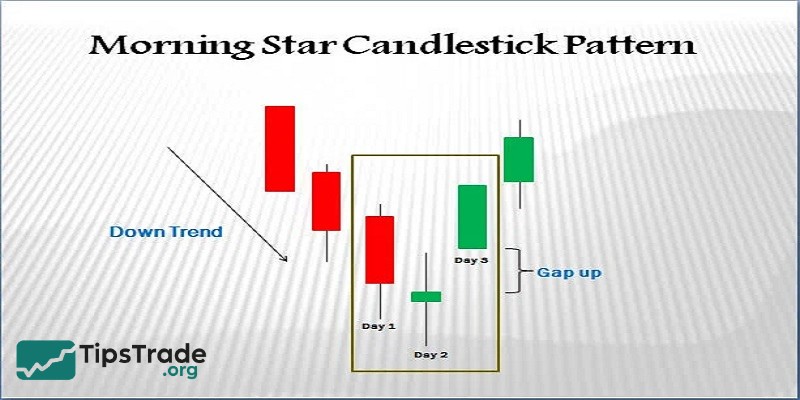
The first candle represents the seller dominating and pushing the price down to an extremely low level. When buyers see prices getting lower and lower, they become hesitant, which leads to the formation of the second candle. The buyers regained control and pushed the closing price higher, which is why the third candle appeared, the reversal occurred, and investors could start placing orders.
Bullish Abandoned Baby
This candlestick pattern is formed by three candles: the first and third candles are large, the middle candle is smaller and quite far from the other two, hence the name “abandoned baby.”
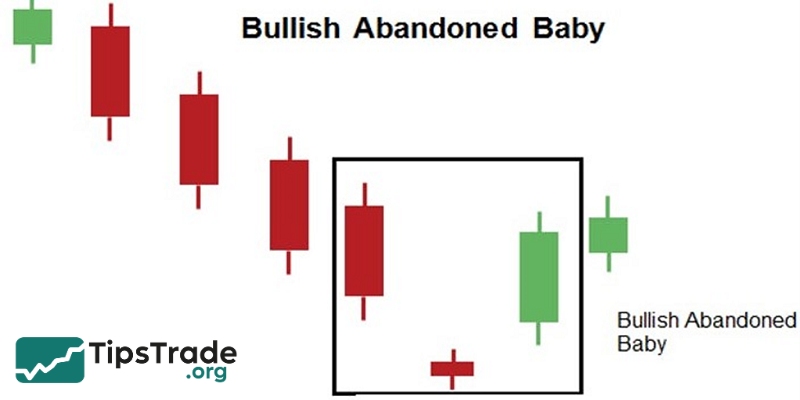
The first candle indicates a strong downward trend in the market. When the price range is narrow and the closing price is close to the opening price, the second candle is formed. The continued decline created a large gap, leading to the appearance of a three-candle pattern, which triggered a large-scale uptrend.
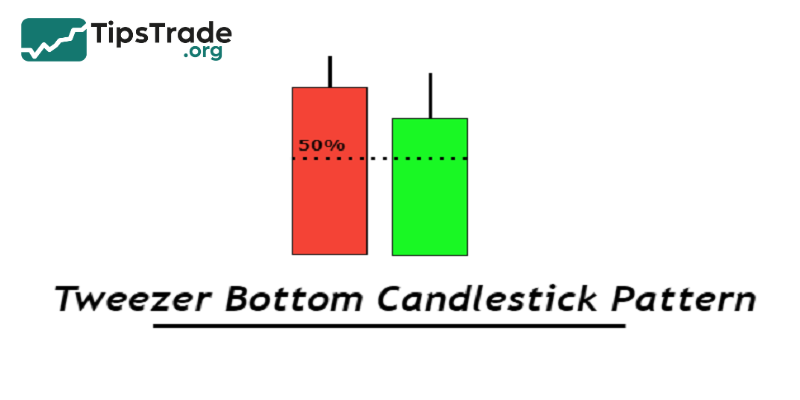
Tweezer Bottom
The Tweezer Bottom is a two-candle pattern where the first candle is a long bearish candle, the second candle is a bullish candle, and its opening price is equal to the previous day’s closing price.
The first candle indicates the price is going down, but the second candle is a sign of market recovery. This allows investors to understand the spread and decide when to enter a trade.
Types of bearish reversal patterns
In contrast to bullish reversal patterns, strong bearish reversal patterns signal an impending downtrend. Based on these bearish reversal patterns, investors should calculate the optimal time to sell and take profits, thereby limiting risk.
Gravestone Doji
The gravestone doji is also a Japanese candlestick pattern that is of great interest to many investors. The appearance of this reversal pattern is a sign that the uptrend has come to an end.
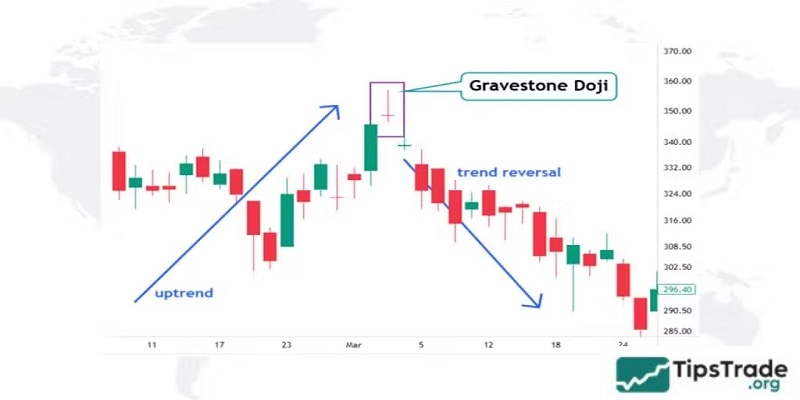
Identifying characteristics: The Gravestone Doji is a smooth candlestick pattern with no body, no lower shadow, and a very long upper shadow.
The appearance of this pattern indicates that buyers are still dominant, and prices continue to rise steadily. When the price rises and touches the peak, there are too many sellers, causing the market to begin to decline.
Observing the Gravestone Doji with longer wicks indicates stronger selling pressure and a higher likelihood of a trend reversal.
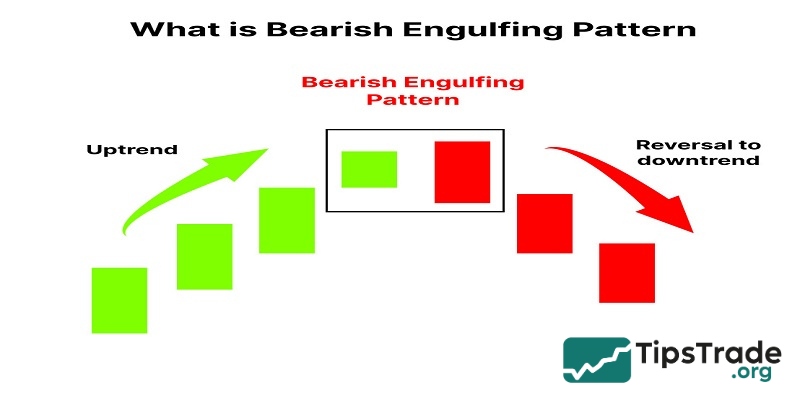
Bearish Engulfing
The Bearish Engulfing is a strong reversal pattern that forms at the end of an uptrend and is a double candlestick pattern. Green candle followed by two red candles, with the second candle completely engulfing the first.
The Bearish Engulfing pattern signals that the market is stalling and beginning to decline. The larger the second candle, the stronger the potential for a reversal.
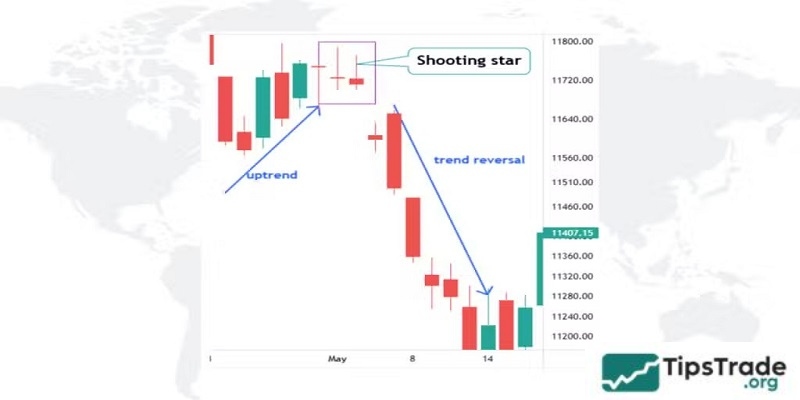
Shooting Star
This pattern is very similar in shape to a Doji candle, but the difference is that it has a small body, the upper shadow is 2-3 times the length of the body, and there is almost no lower shadow.
This reversal pattern requires investor patience; you must observe slowly until the Shooting Star is truly complete, and immediately after it is a bearish candle, only then should you enter the trade to increase its effectiveness.
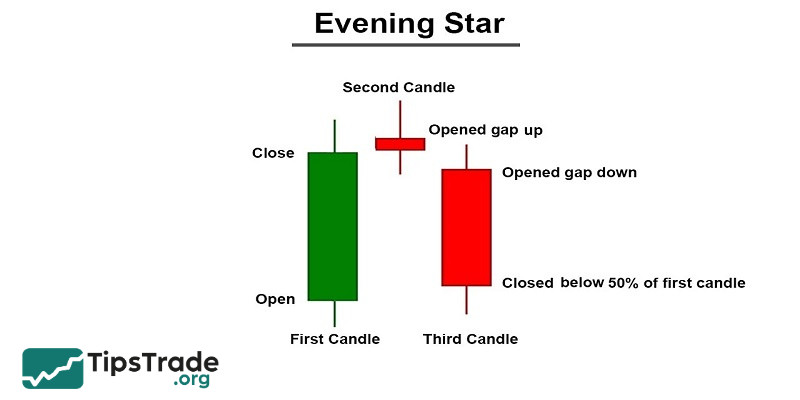
Evening Star
Evening Star is also a three-candle reversal pattern. The first candle is green with a long body, the second two candles are small and star-shaped, the third candle is red with a large body, and the closing price is always within the range of the first candle.
Evening Star shows: If a gap forms between the first and second candles, the reversal rate is very strong.
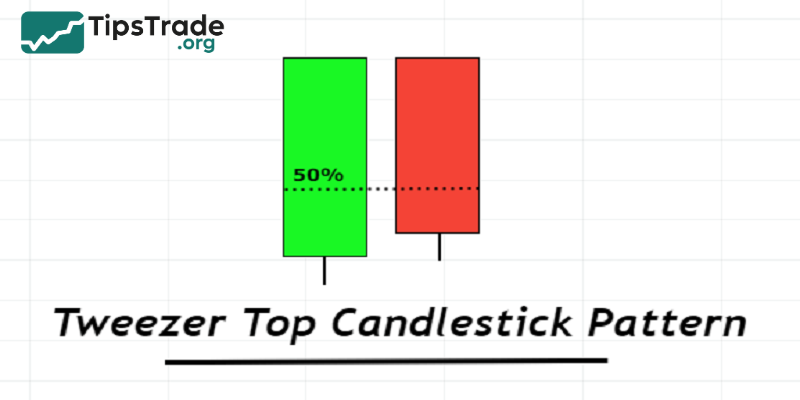
Tweezer Top
The Tweezer Top is a double candlestick pattern. The first candle is a bullish candle with a long upper shadow, a small body, and a short lower shadow. The second candle is a bearish candle, also with a long upper shadow and a small body, and the closing price is equal to the opening price of the first candle.
The first candle shows the buyers are in a dominant position. The next day, the buyers continued to push the price higher but were unsuccessful and were reversed by the sellers. At this point, investors should consider selling.
Principles for trading with reversal patterns
Reversal patterns will signal the market trend, helping investors make accurate and timely judgments. However, to trade successfully, it is necessary to note some principles:
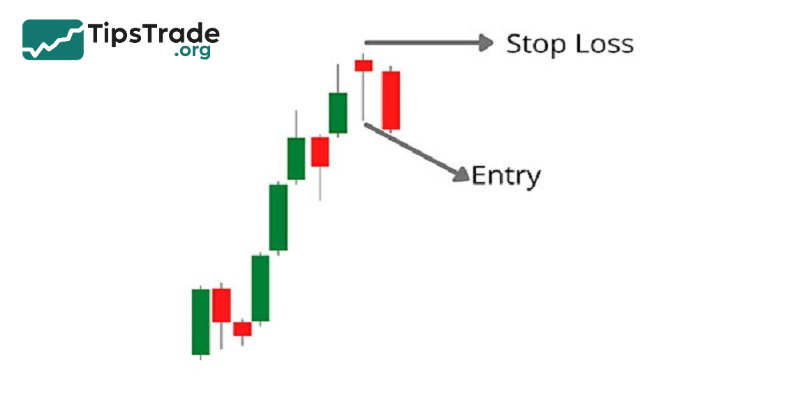
Enter a trade only after the reversal pattern is complete
You need to wait for the last signal candle of the reversal pattern to close to determine the exact type of candlestick pattern before deciding to enter the order. If you rush into the order too early, you are likely to make a wrong judgment and face many risks. So be patient to increase the likelihood of success in trading.
Stop-loss placement
No trading setup is 100% safe. Hence, you should never forget to set a stop-loss to protect yourself from unexpected market movements. In reversal patterns, the stop-loss should be placed above or below the pattern’s extreme point, ideally 2–3 pips away from the candle wick to avoid getting stopped out by temporary price spikes.
Take-profit strategy
In a reversal pattern, the minimum price you use to take profit must be equal to the size of the candlestick pattern. You can apply the R:R rule such as 1:1 or 1:2 to take profit, note that the result will be the minimum profit earned, but the reversal pattern is often better than expected, so you can apply a trailing stop when taking profit to get profit.
Steps for trading with reversal patterns
- Identify the main trend: First, it’s necessary to determine whether the current market trend is up or down. This can be done by observing the peaks and troughs of the price chart as well as using technical analysis tools such as moving averages.
- Look for reversal patterns: Reversal patterns typically appear at important support and resistance levels.
- Confirming the signal: Use additional technical indicators such as RSI and MACD to confirm the reversal signal.
- Determine profit goals: Use Fibonacci levels or the next support/resistance levels to set your take profit orders.
Conclusion
Above is a list of the most popular strong reversal patterns, along with the principles and steps for trading with these reversal patterns that investors need to understand. Tipstrade.org hopes this article can help investors effectively apply reversal patterns, make accurate order placement decisions, and achieve high profits.