
P/E ratio (price-to-earnings ratio) is essential for anyone analyzing stocks or making long-term investment decisions. This simple yet powerful metric helps investors determine whether a company’s stock is overvalued or undervalued based on its earnings performance. In this comprehensive guide, you’ll learn what the P/E ratio means, how it’s calculated, how to interpret it, and its limitations — along with real-world examples and professional insights from financial experts.
What Is P/E Ratio?
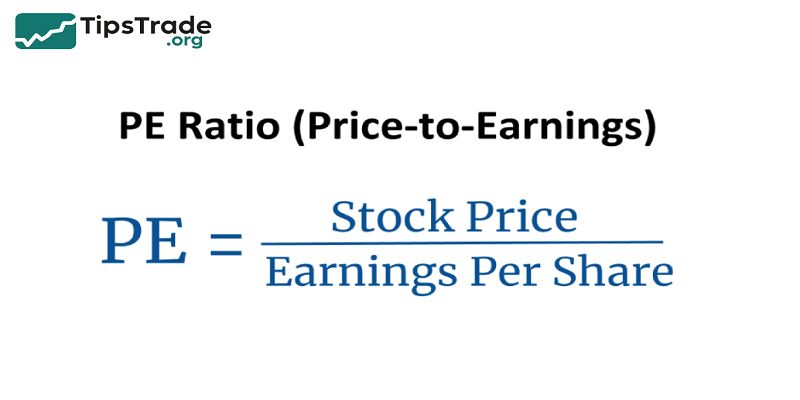
The Price-to-Earnings (P/E) ratio measures how much investors are willing to pay for a company’s earnings.
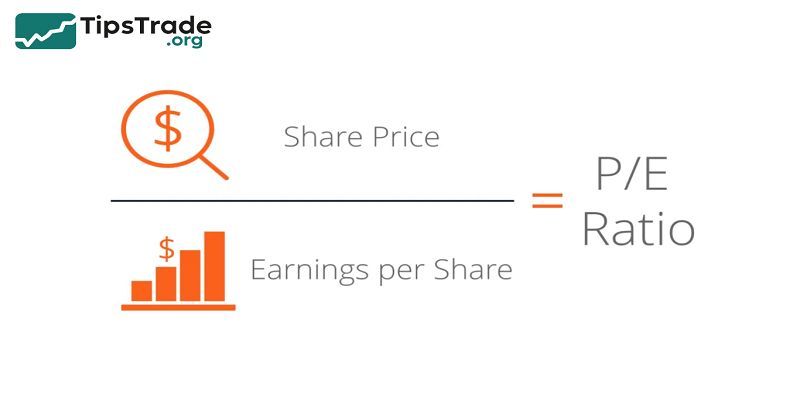
It’s calculated by dividing the market price per share by the earnings per share (EPS).
For instance, if a company’s stock trades at $100 and its EPS is $5, its P/E ratio equals 20 — meaning investors pay $20 for every $1 of profit the company earns.
There are two common types:
- Trailing P/E – uses the past 12 months’ actual earnings (TTM).
- Forward P/E – uses projected earnings over the next 12 months.
A higher P/E usually reflects growth expectations, while a lower P/E can suggest value opportunities or potential risk.
According to Morningstar, the average S&P 500 trailing P/E typically ranges between 15–25, depending on market cycles.
Why Use P/E Ratio in Valuation
Understanding the P/E Ratio
The Price-to-Earnings (P/E) ratio measures how much investors are willing to pay for each dollar of a company’s earnings.
It’s calculated as:
P/E Ratio=Market Price per ShareEarnings per Share (EPS)\text{P/E Ratio} = \frac{\text{Market Price per Share}}{\text{Earnings per Share (EPS)}}
This simple formula captures the market’s expectations for a company’s future profitability.
-
A high P/E suggests that investors expect strong growth or see the company as low risk.
-
A low P/E could indicate undervaluation, weak growth prospects, or higher perceived risk.
Why Investors Use the P/E Ratio

The P/E ratio remains one of the most widely used valuation tools because it offers an immediate view of how the market values earnings relative to price.
Comparability
-
The P/E ratio enables investors to compare companies within the same industry on a standardized basis.
-
For instance, comparing Apple’s P/E with Microsoft’s helps determine which company is priced more richly relative to its profits.
Benchmarking
-
Investors use P/E to see whether a stock trades above or below the industry or market average.
-
A company trading at a P/E significantly higher than peers might indicate overvaluation — or strong market confidence in its future earnings growth.
Historical Trend Analysis
-
By examining historical P/E trends, investors can gauge how the market’s sentiment toward a company has evolved.
-
For example, if a company’s 10-year average P/E is 20 but currently trades at 30, it may reflect increased optimism or temporary overpricing.
Example Scenarios
-
High-growth tech example:
A technology firm with a P/E of 40 may appear expensive, but if its industry average is 35 and it shows consistent earnings growth above peers, it might still be fairly valued or even undervalued relative to its growth potential. -
Value stock example:
A bank trading at a P/E of 10, while the sector average is 12, could signal that it’s undervalued, especially if its fundamentals (ROE, NIM, credit quality) are strong.
Limitations of P/E Ratio
While powerful, the P/E ratio should not be used in isolation. It has several caveats:
-
Earnings volatility: Temporary losses or extraordinary gains can distort EPS and therefore the P/E.
-
Accounting differences: Different accounting methods affect earnings comparability between companies.
-
Growth blind spot: P/E doesn’t directly factor in future earnings growth.
Complementary Metrics
To form a complete valuation picture, investors combine P/E with other indicators:
-
PEG Ratio (Price/Earnings-to-Growth): Adjusts the P/E for expected earnings growth — helpful for growth stocks.
-
P/B Ratio (Price-to-Book): Evaluates valuation relative to net assets — useful for banks and asset-heavy industries.
-
ROE (Return on Equity): Measures how efficiently a company uses shareholder capital to generate profit.
-
EV/EBITDA: Provides a capital-structure-neutral valuation view, useful for comparing companies with different debt levels.
>> See more:
- What is Stock Liquidity? Why It’s Important for Investors
- What is Stock Market Index? Top 8 Stock Market Index You Should Know About
- What Is a Stock Broker? Essential Skills and Average Salary of Being a Stock Broker
- How To Read A Stock Chart: Exploring Key Types & Pro Tips
How to Calculate the P/E Ratio
The formula is straightforward:
P/E Ratio = Price per Share ÷ Earnings per Share (EPS)
Step-by-step Example:
- Find the company’s current share price (e.g., $50).
- Look up its EPS from the latest financial report (e.g., $2.50).
- Divide 50 ÷ 2.5 = 20x P/E ratio.
Alternative Methods:
- Market Cap ÷ Net Income: useful when analyzing entire sectors.
- Adjusted or normalized EPS: removes one-time items like asset sales to get a clearer view of recurring profits.
Pro Tip:
Always specify whether the P/E is forward or trailing, as differences in forecasts can significantly affect interpretation — especially in volatile markets.
Interpreting High vs Low P/E Ratios
Understanding whether a high or low P/E is “good” depends on the context.
| P/E Type | Interpretation | Investor Insight |
| High P/E (e.g., 30–50x) | Investors expect strong future growth | Often found in tech or biotech sectors |
| Low P/E (e.g., 5–12x) | Market doubts future earnings potential | May signal undervaluation or financial distress |
Example:
- Apple (AAPL) – historically trades around 25–30x due to brand strength and consistent growth.
- Ford (F) – may trade closer to 10x, reflecting slower growth and cyclical industry exposure.
A low P/E doesn’t always mean cheap — it could indicate declining profits or industry headwinds. Meanwhile, a high P/E can be justified if the company is growing earnings quickly.
Limitations of the P/E Ratio
- While useful, the P/E ratio isn’t a perfect valuation tool. Professional analysts always combine it with other metrics to avoid misleading conclusions.
Key Limitations:
- Earnings volatility: If profits fluctuate, the P/E can swing dramatically.
- Negative earnings: A company with losses has no valid P/E.
- Accounting distortions: Non-recurring items can inflate or deflate EPS.
- Ignores growth: Two companies with the same P/E might have very different earnings growth rates.
For instance, Tesla’s P/E was above 80x in certain years — unsustainable if earnings growth slows.
Therefore, investors often use the PEG ratio (P/E ÷ earnings growth) to adjust for expected performance.
P/E Ratio in Practice: Real-World Examples
Example 1: Technology Stock
- A fast-growing software company reports a P/E of 50x.
- This high multiple indicates investors expect rapid revenue expansion, possibly 20–30% per year.
- However, if earnings fail to meet expectations, the stock can fall sharply.
Example 2: Utility Stock
- A regulated utility firm has a P/E of 10x, reflecting steady but limited growth.
- Investors value it for dividend stability rather than high appreciation potentia.
Example 3: Sector Comparison
| Sector | Average P/E (2025) | Risk Level |
| Technology | 30–40x | High |
| Healthcare | 18–25x | Moderate |
| Industrials | 15–20x | Medium |
| Utilities | 10–15x | Low |
Source: Morningstar Market Data, 2025
Such comparisons help investors identify which sectors may be overvalued or offer better entry points.
Forward & CAPE P/E
Forward P/E Ratio (Price-to-Forecasted Earnings)
Definition
The Forward P/E ratio uses projected (future) earnings instead of trailing 12-month earnings.
Formula:
Forward P/E=Current Market Price per ShareExpected Earnings per Share (Next 12 Months)\text{Forward P/E} = \frac{\text{Current Market Price per Share}}{\text{Expected Earnings per Share (Next 12 Months)}}
This ratio reflects how much investors are willing to pay today for each dollar of expected future earnings.
Key Applications
-
Growth-oriented valuation:
Especially useful for high-growth sectors (e.g., technology, biotech) where future profits are more relevant than current earnings. -
Market sentiment indicator:
A falling Forward P/E (while price remains stable) can signal analysts upgrading earnings forecasts — a bullish signal. -
Cross-sector comparison:
Provides a forward-looking benchmark when comparing companies with different growth trajectories.
Limitations & Risks
-
Forecast uncertainty:
Analyst earnings estimates may be overly optimistic or inconsistent, leading to misleading valuations. -
Cyclicality distortion:
In cyclical industries (like energy or manufacturing), earnings forecasts can swing dramatically, skewing the Forward P/E. -
Short-term bias:
Since it typically uses 12-month projections, it may not capture long-term growth sustainability.
Example
If Company A trades at $100 per share, and analysts project $5 EPS next year:
→ Forward P/E = 100 / 5 = 20
If next year’s actual EPS comes in lower (say $4), the realized P/E jumps to 25, exposing the risk of forecast errors.
CAPE Ratio (Cyclically Adjusted Price-to-Earnings)
(Also known as the Shiller P/E)
Definition
- The CAPE ratio, developed by Nobel laureate Robert J. Shiller, smooths out short-term earnings volatility by using average inflation-adjusted earnings over the past 10 years.
- CAPE=Current Price (or Index Level)Average Real Earnings (10 years, inflation-adjusted)\text{CAPE} = \frac{\text{Current Price (or Index Level)}}{\text{Average Real Earnings (10 years, inflation-adjusted)}}
This makes it a long-term valuation metric, less influenced by temporary economic booms or recessions.
Key Purpose
-
Economic cycle adjustment:
By averaging earnings across an entire business cycle, CAPE removes noise from one-off shocks (like recessions or windfall profits). -
Macro market valuation:
Commonly used to evaluate entire stock markets (e.g., S&P 500 CAPE) rather than individual companies. -
Timing tool for long-term investors:
Helps identify broad overvaluation or undervaluation in equities.
Interpretation Benchmarks
Historically (based on S&P 500 data):
-
CAPE > 30: Market is considered overvalued → future returns may be lower.
-
CAPE ≈ 20–25: Fairly valued range.
-
CAPE < 15: Potential undervaluation → higher long-term return expectations.
For instance:
-
In 1999 (Dot-com bubble), S&P 500 CAPE peaked above 40 — signaling an overheated market.
-
In 2009 (Post-crisis), CAPE fell below 15, marking a historic buying opportunity.
Limitations
-
Slow-moving indicator:
CAPE changes gradually; it’s not suitable for short-term trading. -
Accounting changes:
Over decades, evolving accounting standards can distort comparability of past and present earnings. -
Interest rate impact:
In low-rate environments, higher CAPEs may still be justified because discounted future cash flows are worth more.
Summary Comparison
| Metric | Earnings Basis | Time Focus | Best For | Key Strength | Main Weakness |
|---|---|---|---|---|---|
| Trailing P/E | Past 12 months (actual EPS) | Present | Quick snapshot | Uses real data | Backward-looking |
| Forward P/E | Forecasted EPS (next 12 months) | Near future | Growth stocks | Anticipates future | Forecast bias |
| CAPE (Shiller P/E) | 10-year inflation-adjusted avg EPS | Long-term | Market-level valuation | Smooths cycles | Slow response |
Conclusion
The P/E ratio is one of the most popular — yet most misunderstood — valuation tools in finance. It offers a quick insight into how the market values a company’s profits but should be used alongside metrics like growth rate, cash flow, and debt levels for a complete analysis. The article above from Tipstrade.org has just provided you . We hope that you find it useful. Wishing you successful trading!
>>See more: