

Net Asset Value, commonly abbreviated as NAV, is one of the most important concepts for investors in mutual funds, ETFs, and other pooled investment vehicles. NAV represents the per-share value of a fund’s total assets minus its liabilities. This guide will explain what NAV is, how it is calculated, factors affecting it, and how investors use it effectively, all in a people-first, authoritative manner. Explore the detailed article at tipstrade.org to be more confident when making important trading decisions
What Is Net Asset Value (NAV)?
Simple Definition of Net Asset Value
- Net Asset Value (NAV) is the total value of a fund’s assets minus its liabilities, divided by the number of shares or units outstanding.
- Essentially, it shows the value of each share of a fund at a specific point in time. NAV is widely used for mutual funds, ETFs, hedge funds, and other pooled investment vehicles.
- For example, if a fund owns $10 million in assets and has $1 million in liabilities with 900,000 shares outstanding, the NAV per share is ($10,000,000 – $1,000,000) ÷ 900,000 = $10 per share.
- NAV provides a transparent, standardized way to value a fund and is published regularly to inform investors.
- Regulators like the SEC require funds to calculate and disclose NAV consistently, ensuring transparency and fairness for all investors.
- Understanding NAV allows investors to see the real-time value of their investment without relying solely on market fluctuations.
Why Net Asset Value Matters for Mutual Funds and ETFs
- NAV is crucial because it reflects the underlying value of a fund’s assets and helps investors make informed decisions.
- For mutual funds, NAV is typically calculated at the end of each trading day and serves as the price at which investors can buy or redeem shares.
- For ETFs, NAV provides a reference value, although the actual trading price may differ slightly due to market demand, creating premiums or discounts. Many beginner investors mistakenly equate a high NAV with a better fund, but the absolute NAV does not indicate performance; instead, trends and total returns matter.
- NAV also helps compare different funds objectively, monitor growth over time, and evaluate fund management efficiency.
- Financial advisors recommend tracking NAV alongside distributions and fees for a comprehensive understanding of a fund’s health.
How to Calculate NAV (Formula Explained)
Standard NAV Formula
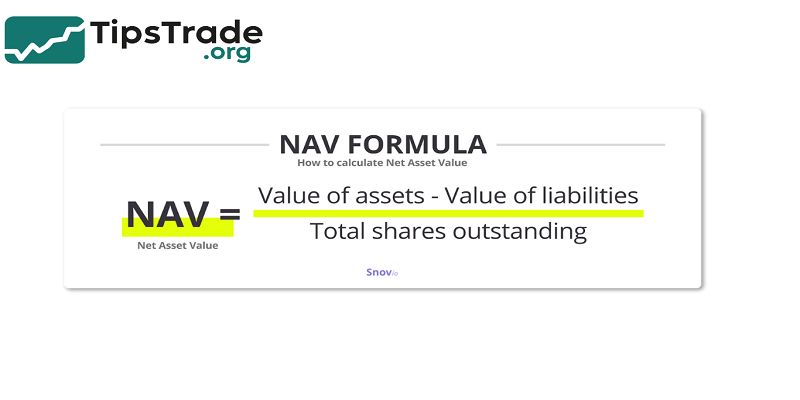
NAV is calculated using a straightforward formula:
NAV = (Total Assets – Total Liabilities) ÷ Shares Outstanding
- Total Assets include cash, stocks, bonds, receivables, and accrued income.
- Total Liabilities cover debts, expenses, and pending obligations.
- Shares Outstanding represent the total units held by investors.
This calculation allows investors to see the per-share value of their investment. While the formula is simple, applying it accurately requires precise accounting and real-time market valuations for each asset in the fund.
The Investment Company Institute reports that accurate NAV calculation is essential for regulatory compliance and investor trust.
Example of Net Asset Value Calculation
Suppose a mutual fund holds:
- $8 million in stocks
- $2 million in bonds
- $500,000 in cash
Liabilities include $300,000 in expenses. The fund has 1 million shares outstanding.
NAV per share = ($8,000,000 + $2,000,000 + $500,000 – $300,000) ÷ 1,000,000 = $10.2 per share.
This example demonstrates how each component contributes to NAV, allowing investors to see how gains, losses, or expenses affect per-share value.
What’s Included in Total Assets and Liabilities?

Total assets typically consist of:
- Cash and cash equivalents
- Equity and fixed-income securities
- Accrued income, like dividends or interest receivable
Total liabilities often include:
- Management fees and operational costs
- Short-term borrowing or debt obligations
- Pending distributions to shareholders
Understanding the composition of assets and liabilities is key to evaluating the fund’s financial health and potential risks.
Net Asset Value vs. Market Price
Net Asset Value for Mutual Funds
- For mutual funds, NAV is the official price used for transactions. Investors buy and redeem shares based on the end-of-day NAV. Unlike ETFs, mutual fund prices do not fluctuate intraday.
- Daily NAV calculation ensures fairness and transparency, allowing all investors to transact at the same per-share value.
- This approach helps prevent price manipulation and maintains consistent valuation.
Net Asset Value vs Market Price for ETFs
- ETFs trade like stocks, meaning their market price may differ from NAV due to supply and demand.
- A premium occurs when the market price is higher than NAV; a discount occurs when it is lower.
- Arbitrage mechanisms involving authorized participants help align ETF prices with NAV.
- Understanding this difference is crucial for investors to avoid paying more than the intrinsic value of the fund’s assets.
Net Asset Value in Different Types of Funds
Net Asset Value in Open-End Funds
- Open-end funds calculate NAV daily and allow investors to buy or redeem shares at that price.
- NAV reflects changes in asset prices, dividends, interest, and fund expenses. This mechanism ensures liquidity while providing a transparent per-share value.
Net Asset Value in Closed-End Funds
- Closed-end funds issue a fixed number of shares that trade on exchanges. Market price may fluctuate above or below NAV based on demand.
- Investors must consider both NAV and market price to evaluate potential purchases.
Net Asset Value in Hedge Funds and Private Funds
- Hedge funds and private funds may calculate NAV less frequently, often monthly or quarterly.
- Illiquid or hard-to-value assets, such as private equity holdings, can complicate NAV computation.
- Accurate NAV reporting is essential to measure performance and determine investor distributions.
Factors That Affect Net Asset Value
Market Movements
- NAV is highly influenced by asset price changes. If stock or bond values increase, NAV rises; if markets decline, NAV decreases.
- For funds with international holdings, currency fluctuations also impact NAV.
Fund Expenses and Fees
- Management fees, administrative costs, and operating expenses reduce NAV.
- For example, a fund with a 1.5% annual expense ratio will experience a corresponding decrease in NAV, even if the underlying assets appreciate.
Dividend Payouts and Capital Gains
- When a fund distributes dividends or capital gains, NAV decreases by the payout amount.
- Investors receive these payments, but the per-share NAV drops to reflect the outflow of cash.
How Investors Use Net Asset Value

NAV as a Performance Indicator
- NAV alone does not measure total return; investors must consider dividends, interest, and capital gains.
- Tracking NAV over time helps identify trends in fund growth or decline, providing insight into fund management effectiveness.
NAV and Fund Comparisons
- Comparing NAVs between funds requires caution. A higher NAV does not indicate a better-performing fund.
- Instead, total return, risk-adjusted performance, and consistency should guide comparisons.
NAV Trend Analysis
- Analyzing NAV trends can reveal a fund’s stability, growth trajectory, and risk exposure.
- Investors often chart NAV alongside distributions to understand performance patterns over multiple periods.
Common Misconceptions About NAV
“Higher NAV Means Better Fund” – Why It’s Wrong
- Many beginners assume higher NAV indicates superior performance.
- In reality, NAV reflects cumulative growth and initial share price, not relative performance.
- For example, a fund with a NAV of $50 may have grown slowly, while a $10 NAV fund may have achieved higher percentage returns.
NAV Does Not Equal Market Value
- Especially for ETFs and closed-end funds, market price may differ from NAV due to investor demand. Understanding this distinction helps avoid overpaying or misjudging value.
How Net Asset Value Is Updated and Reported
Daily NAV Calculation Process
- Mutual funds typically calculate NAV after market close. Fund accountants update asset prices, deduct liabilities, and divide by shares outstanding.
- The process ensures consistent and accurate valuation for investors.
NAV Publication Requirements
- Regulators like the SEC mandate transparency in NAV reporting. Fund companies must disclose NAVs on official websites and financial platforms such as Morningstar and Bloomberg.
- This practice builds investor trust and supports informed decision-making.
Net Asset Value Tools and Resources

Websites to Check NAV
- Morningstar – detailed fund analysis
- Bloomberg – real-time updates
- Fund provider websites – official NAV reporting
- Yahoo Finance – convenient tracking
How to Analyze NAV Trends Using Charts
- Charting NAV over months or years allows investors to visualize performance, volatility, and long-term growth.
- Trend analysis helps identify stable funds versus highly volatile options, supporting strategic investment choices.
Conclusion
Net Asset Value (NAV) is a foundational metric for evaluating mutual funds, ETFs, and other investment vehicles. By understanding NAV calculation, factors affecting it, and how it relates to market price, investors can make informed decisions, track performance, and manage risks effectively. Accurate NAV interpretation, combined with total return analysis and fee consideration, empowers both beginners and experienced investors to build strong, diversified portfolios with confidence. Using authoritative sources, real examples, and practical tools ensures a people-first approach to understanding NAV and its role in successful investing.