
Amidst the “matrix” of thousands of support tools on the MetaTrader 4 platform, which MT5 technical indicator is truly effective in helping you make a profit? Let’s explore the details together with Tipstrade.org in the article below.
Overview of MT5 technical indicator
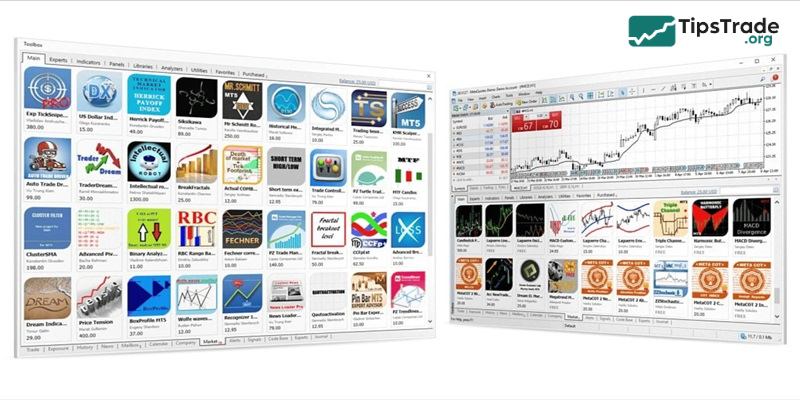
MT5 technical indicators are technical analysis tools used on the MetaTrader 5 platform to detect trends, analyze market data, and generate trading signals. These indicators assist traders in making informed decisions about when to enter or exit trades on various financial instruments.
See more:
- Explore top 5 best indicators TradingView
- Discover the top 6 indicators in MT4 that are widely used
- What is MT5? Basic Guide on How to Use the MT5 Trading Platform
- How to Install MT5 on Any Device: Complete Guide 2025
Benefits of using MT5 technical indicator in trading
- Enhancing Decision-Making: MT5 technical indicators provide objective data that helps traders make informed decisions, reducing emotionally driven trading.
- Customization: MT5 supports creating custom indicators to suit specific trading strategies, providing traders with greater flexibility.
- Multi-asset capability: MT5 technical indicators can be used not only for crypto but also applied to forex, stocks, and commodities, providing versatility.
- Automated Trading: Traders can use indicators to develop automated trading systems, ensuring consistent strategy execution without emotional influence.
- Comprehensive Analysis: By combining different indicators, traders can conduct a thorough market analysis, increasing their chances of successful trades.

Top 10 best MT5 technical indicator
This content section will filter out the top 10 best MT5 technical indicator trusted by experts, categorized by purpose to help you easily build your own trading system.
Group 1: Trend indicators – “Trend is friend”
This group helps you identify the market’s main direction (Uptrend or Downtrend) so you never end up “standing in front of a moving train.”
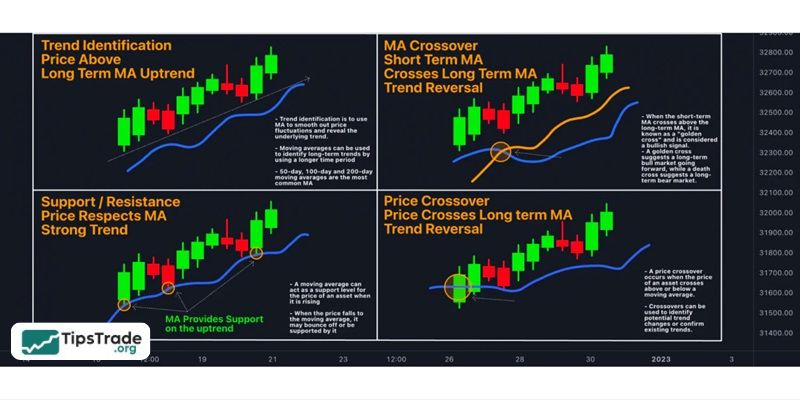
Moving Average (MA)
This is the “king” of indicators: simple but extremely powerful.
- Usage: Smooth price data to indicate the overall trend.
- How to use:
– SMA (Simple Moving Average): Use SMA 200 to identify long-term trends. Prices above the 200 SMA indicate an uptrend, while prices below indicate a downtrend.
– EMA (Exponential Moving Average): Use EMA 34 or 89 to find entry points because it reacts faster to price changes.
- Tips trade: Use the crossover of the short and long EMAs to find early reversal signals.
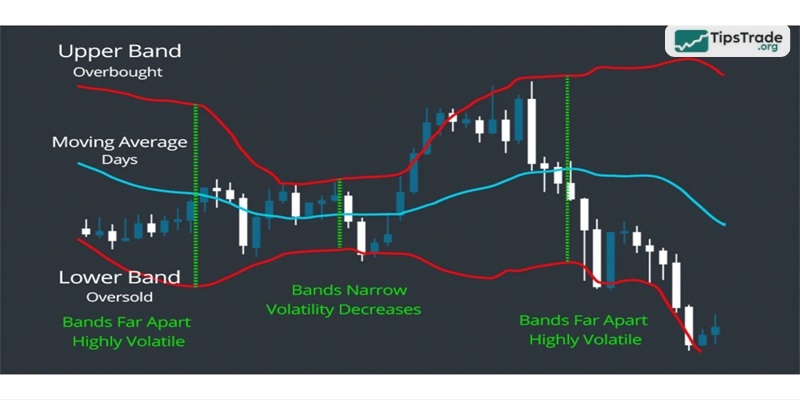
Bollinger Bands
- Usage: Measures market volatility.
- How to use: When the band contracts (Bottleneck), it signals that the market is about to experience strong volatility (Breakout). When the price touches the upper or lower band, the trend may stall or reverse.
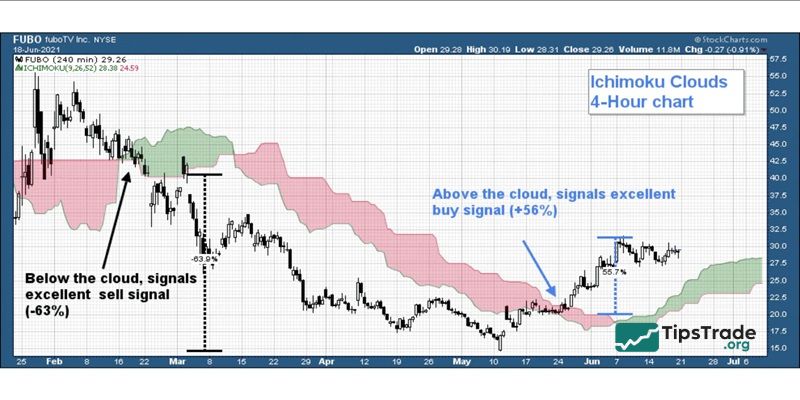
Ichimoku Kinko Hyo
- Usesage: A Japanese “All-in-one” system. Just a glance can reveal trends, support/resistance, and momentum.
- Strengths: Kumo Cloud is an extremely reliable support zone that few indicators can compare to.
Group 2: Momentum indicators (Oscillators) – Identifying reversal points
This group helps you determine whether the market is “overheated” or “cooled down,” allowing you to decide when to buy the dip or sell the top.
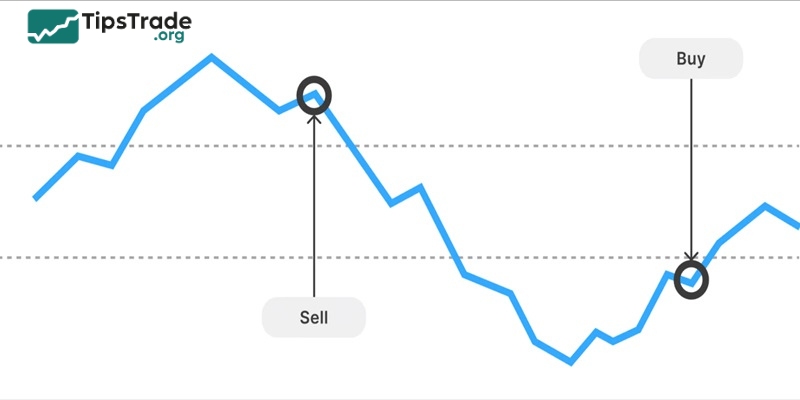
RSI (Relative Strength Index)
This is the best MT5 technical indicator for identifying overbought and oversold zones.
- Usage: RSI > 70 (Overbought – Sell), RSI < 30 (Oversold – Buy).
- Tips trade: Don’t just trade based on the 30/70 level. Let’s look for divergence signals between price and RSI. This is a very accurate reversal signal.
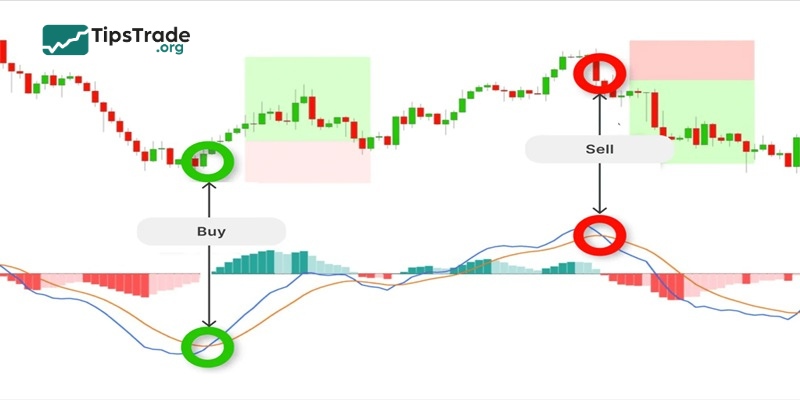
MACD (Moving Average Convergence Divergence)
- Usage: Shows the strength of the current trend.
- How to use: Observe the intersection between the MACD line and the signal line, combined with the Histogram chart, to determine whether buying/selling pressure is increasing or decreasing.
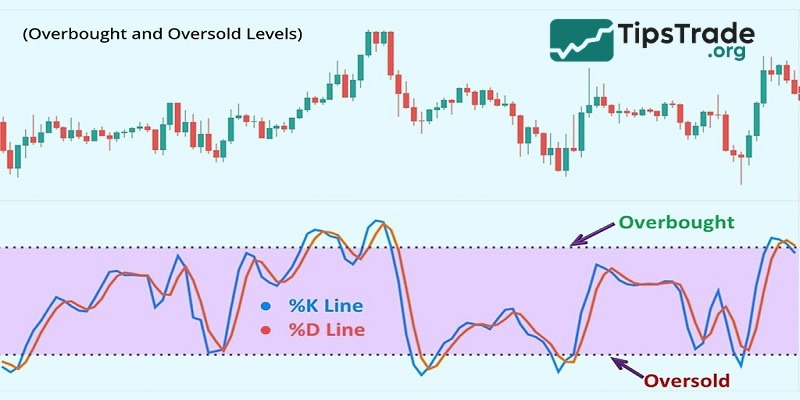
Stochastic Oscillator
- Uses: Similar to RSI but more sensitive, suitable for sideways markets.
- How to use: Find the intersection of the %K and %D lines in the overbought/oversold zone to quickly enter a scalping trade.
Group 3: Support & resistance indicators
These indicators help you identify the market’s “floor” and “ceiling” levels.
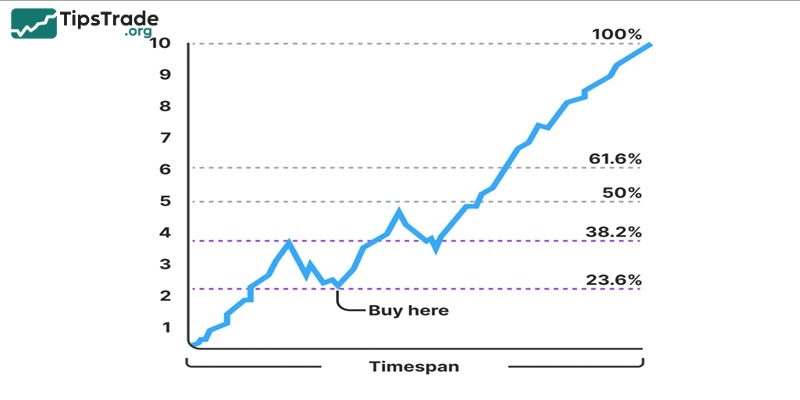
Fibonacci Retracement
- Usage: Measures the degree of price retracement within a trend.
- Golden ratios: 0.5 and 0.618. Prices often tend to bounce back when they hit these levels.
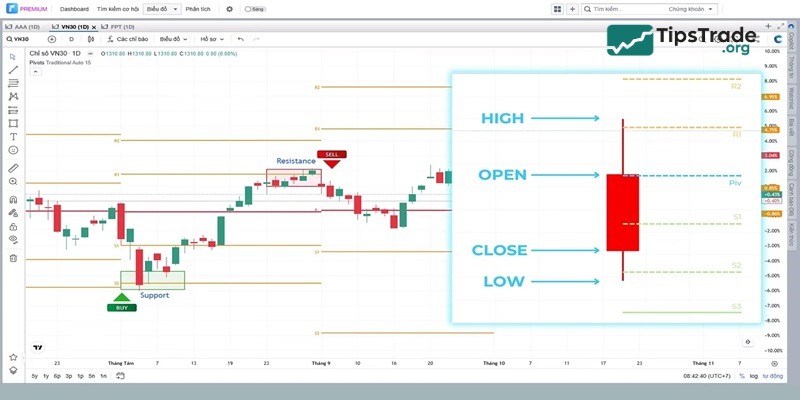
Pivot Points
- Usage: Automatically calculates important support (S) and resistance (R) levels for the day based on the previous day’s price.
- Benefits: Very objective, widely used by Big Boys (banks, funds) to set take-profit levels.
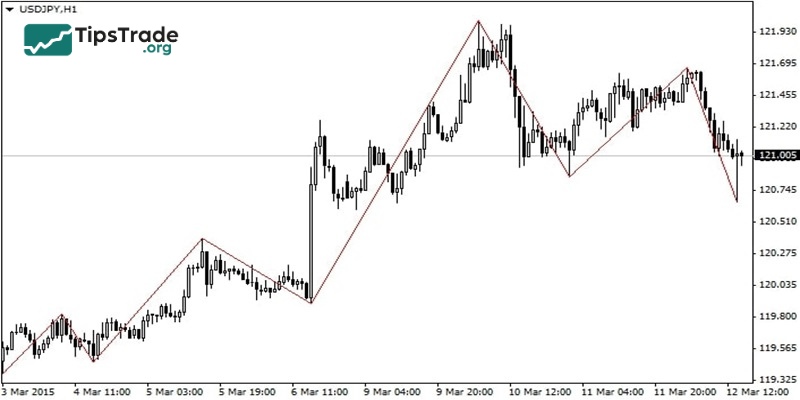
ZigZag
- Uses: Filters market noise, helping you clearly see the Peak/Trough (High/Low) structure.
- Application: Great for drawing Trendlines or counting Elliott waves more accurately.
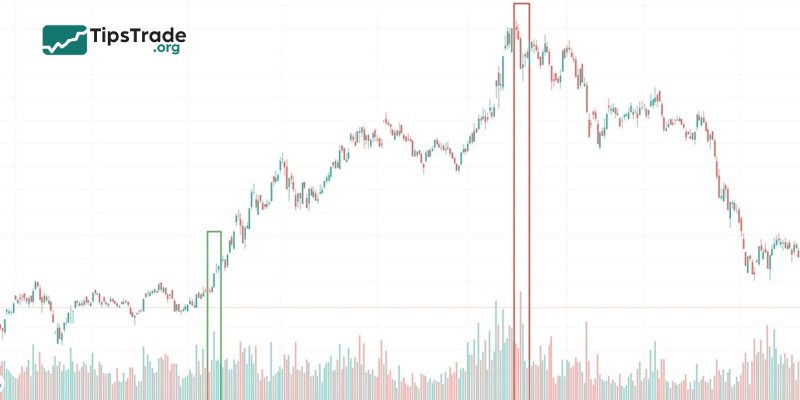
Volume
- Usage: Confirms the strength of the trend.
- Rule: Price increases while volume increases => Sustainable trend. Price increases while volume decreases => Sign of weakness, be careful of a reversal.
Strategy for combining MT5 technical indicators
Having the best MT5 technical indicator doesn’t mean you should install all of them on your chart. That will only confuse you.
Golden rule: Combine 2–3 indicators from different groups to achieve confluence (confirmation).
Example of a practical combo:
- Identify the trend: Use the 200 MA or Bollinger Bands.
- Find entry points: Wait for the price to retrace to the 0.618 Fibonacci level.
- Confirm the signal: Look for RSI divergence or oversold conditions.
How to add MT5 technical indicator to trading chart
Adding MT5 technical indicator to trading chart is a straightforward process:
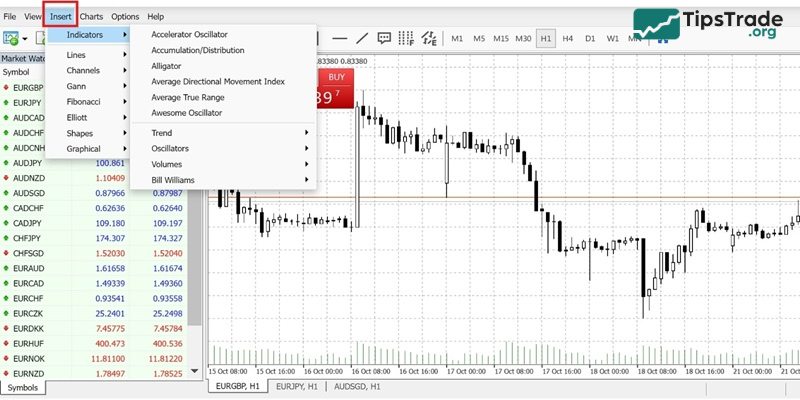
- Open MetaTrader 5 and go to the “Insert” menu.
- Select “Indicators” from the dropdown menu.
- Choose the desired indicator category (e.g., Trend, Oscillators, Volume).
- Click on the specific indicator you want to add.
- Customise the indicator settings (You can modify factors like moving average periods, RSI levels, or Bollinger Band deviations) if needed and click “OK.”
- You’ll see the indicator displayed on your chart, providing additional insights for your technical analysis.
For custom indicators downloaded from external sources:
- Ensure the downloaded indicator file is in either .mq5 or .ex5 format. Copy the file.
- Go to “File” -> “Open Data Folder” in your MT5 platform.
- Within the Data Folder, locate the “MQL5” folder and then open the “Indicators” folder within MQL5.
- Paste the copied indicator file (.mq5 or .ex5) into the “Indicators” folder.
- Close and reopen your MT5 platform for the indicator to be recognised.
- Once restarted, follow steps 1-4 from the “Adding Indicators to Your MT5 Charts” section to add the custom indicator to your desired chart.
Important note: Downloading custom indicators from untrusted sources poses security risks. Exercise caution and only download indicators from reputable sources with good reviews.
Final thoughts
Above are the Top 10 best MT5 technical indicator in 2025 every trader should know. Remember, indicators are just support tools; trading mindset and capital management are the decisive factors for success or failure. Wishing you the best in choosing the right “weapon” and trading successfully!
See more: