
The Morning Star candlestick pattern is one of the most common reversal patterns in trading. With its distinctive structure and strong implications, this pattern not only helps identify a reversal from a downtrend to an uptrend but also provides effective trading opportunities when used correctly. In this article, we will explore in detail what the Morning Star candlestick is, how to identify it, its significance, and the most effective ways to trade it.
What is a Morning Star candlestick?
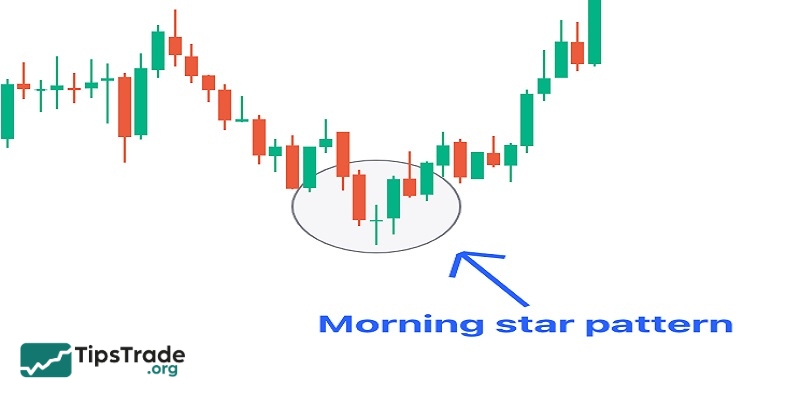
The Morning Star candlestick pattern is a bullish reversal pattern formed by three consecutive candlesticks on a price chart. It typically appears at the end of a downtrend and signals the potential for prices to rebound. The name “Morning Star” evokes the image of a star appearing before dawn, bringing hope for a brighter new day after the dark phase of a downtrend.
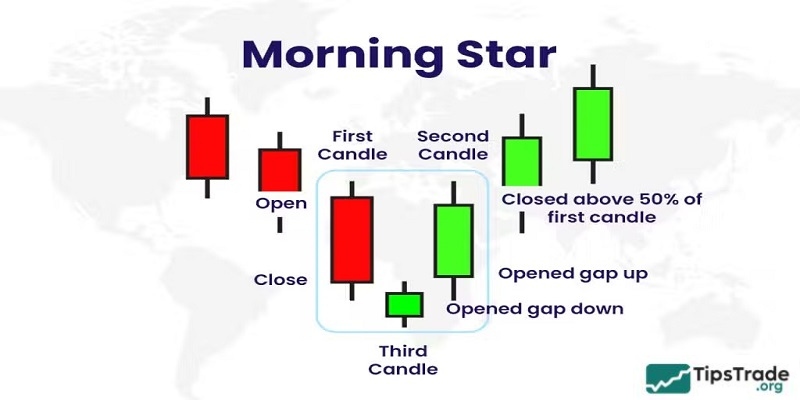
The Morning Star pattern consists of three candlesticks with the following characteristics:
- First candlestick: A strong bearish candle with a long real body, reflecting heavy selling pressure and the dominance of the downtrend.
- Second candlestick: A small candle that can be either bullish or bearish, usually with a short body or in the form of a Doji. This candle indicates market indecision, as neither buyers nor sellers are in control. A gap between the first and second candles, or between the second and third candles, may occur, especially in stock markets.
- Third candlestick: A strong bullish candle with a long real body, confirming the reversal as buyers push prices higher. This candle typically closes above the 50% level of the first candlestick’s body.
Related posts:
- How to Trade with the Piercing Candlestick Pattern Effectively
- Spinning Top Candlestick and How to Apply It in Technical Analysis
- Shooting Star Candlestick Pattern: How to Identify and Trade It Effectively
- Marubozu Candlestick: A Detailed Guide to Identification and Effective Trading
Meaning of the Morning Star candlestick
Understanding the trading psychology behind the Morning Star candlestick helps you assess its reliability:
- Candle 1 (Bears in control): Strong selling pressure dominates the market, reflecting a pessimistic sentiment. Traders are aggressively selling or short-selling, pushing prices lower.
- Candle 2 (Indecision and balance): After a series of declining sessions, selling pressure begins to ease. This may be because prices have reached a key support level, or simply because the bears are becoming exhausted. Bulls start to step in, attempting to buy at lower prices. The appearance of a small-bodied candle (especially a Doji) signals hesitation and a lack of conviction from both sides. Prices may open lower (gap down) but are not driven much further down. This represents a potential turning point.
- Candle 3 (Strong bullish counterattack): The bulls have accumulated sufficient strength and confidence to push prices higher. Buying pressure completely overwhelms selling pressure. A sharp price increase that closes deeply into the body of the first bearish candle clearly indicates a shift in market sentiment. The prior downtrend is likely coming to an end, and a new uptrend may be forming.
Overall, the Morning Star candlestick reflects a transfer of control from bears to bulls. It serves as a warning signal that a potential “bottom” may have been established and that a rebound or trend reversal could be approaching.
Identifying the Morning Star candlestick
To accurately identify the Morning Star candlestick pattern, traders should pay attention to the following factors:
- Prerequisite: The pattern must appear after a clearly defined downtrend. A Morning Star that forms in a sideways market or during an uptrend is far less reliable.
- Check candle 1: Identify a long bearish candle that demonstrates the strength of the bears.
- Check candle 2: Look for a small-bodied candle immediately following candle 1. This candle may be bullish, bearish, or a Doji. Pay attention to whether there is a downside gap between the close of candle 1 and the open of candle 2 (a gap down increases reliability). The wick/shadow of candle 2 may be long or short, but the real body must be small.
- Check candle 3: Identify a long bullish candle immediately after candle 2. Note whether there is an upside gap between the close of candle 2 and the open of candle 3 (a gap up increases reliability). Most importantly, the closing price should rise above the 50% level of the first candle’s body.
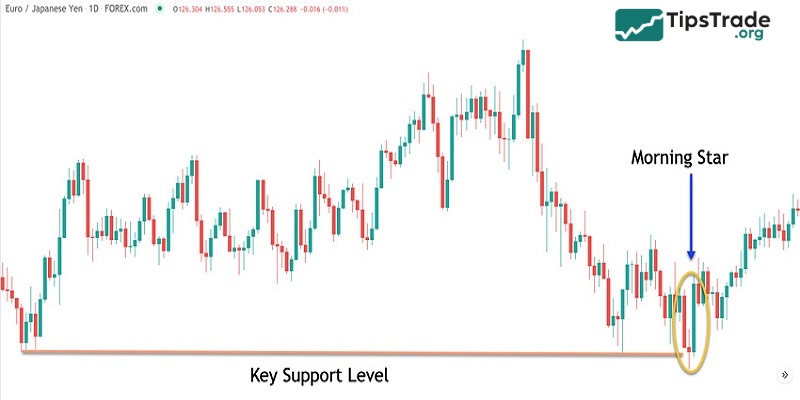
- Location: Check whether the pattern appears at key support levels, along a descending trendline, or in oversold zones (as indicated by RSI or Stochastic). Such confluence significantly enhances the reliability of the signal.
Notes on variations:
- The second candle may be a Doji, forming the Morning Doji Star candlestick. This is an exceptionally strong reversal signal, as the Doji reflects extreme indecision before the bulls take control.
- Price gaps increase reliability but are not mandatory in all cases, especially in less volatile markets or on smaller time frames. However, when gaps do occur, the signal tends to be stronger.
How to trade the Morning Star candlestick effectively
After identifying the morning star candlestick pattern, the next important step is to know how to act. Below is a detailed guide for effective trading:
Step 1: Signal confirmation
This is the most important step and is often overlooked by new traders. The Morning Star candlestick is only a potential signal; we must wait for confirmation from the market before entering a trade.
- Price confirmation: Wait for the next candlestick (after the third candle of the pattern) to close above the closing price of the third candle. Alternatively, wait for the price to break above a nearby minor resistance level that was formed before or during the development of the pattern.
- Volume confirmation: Trading volume often spikes during the formation of the third candle or on the subsequent confirmation candle. A strong increase in volume accompanying the price rise of the third candle indicates that bulls are entering the market in force, confirming the reversal.
- Confirmation using other indicators: Combine the pattern with other technical indicators such as RSI (moving out of the oversold zone), MACD (the MACD line crossing above the signal line from below or the histogram shifting from negative to positive), and Stochastic (the %K line crossing above the %D line from below in the oversold zone).
A trade should only be entered when at least one or, preferably, multiple confirming factors present.
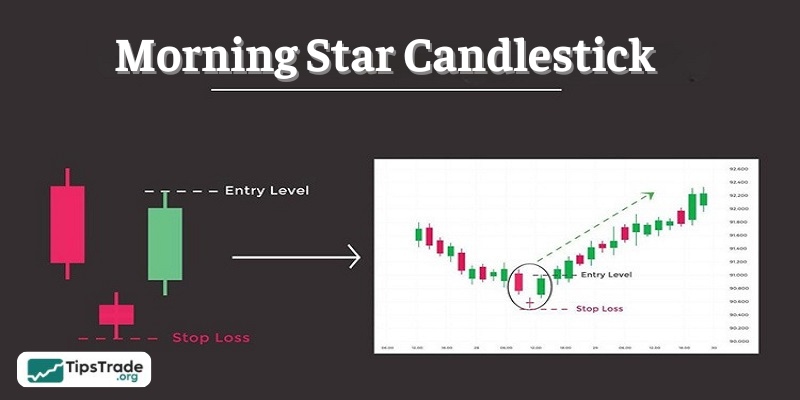
Step 2: Entry points
After confirmation, you can consider entering a buy (long) position at the following levels:
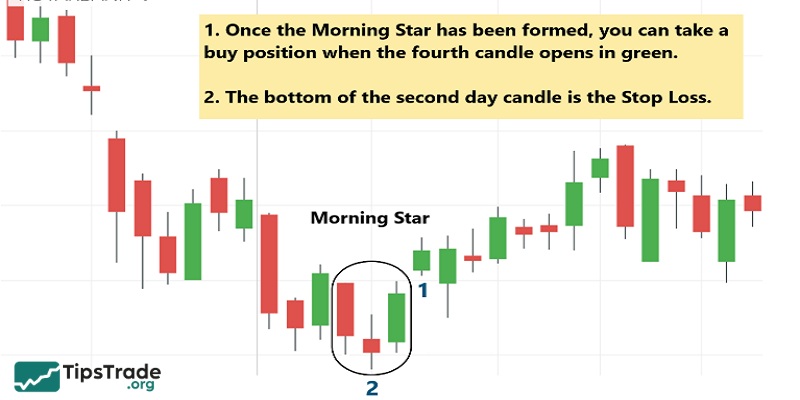
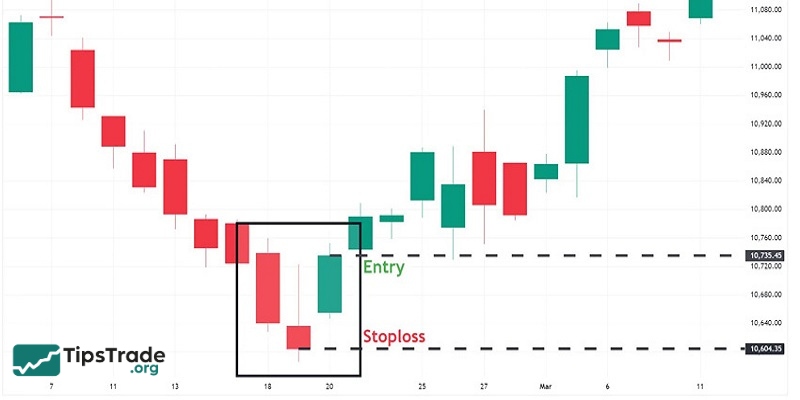
- Safe entry point: Place a buy order immediately after the confirmation candle closes above the closing price of the third candle. This entry is suitable for cautious traders.
- Earlier (more aggressive) entry: You may enter a buy trade as soon as the third candle closes, especially if it closes strongly with a surge in volume. However, this entry carries higher risk because it lacks confirmation from the subsequent candle.
- Pullback entry: Sometimes price may rise slightly after the pattern forms and then pull back toward the high of the third candle or the midpoint of its body. This can offer a good, lower-risk entry opportunity if you missed the initial entry.
Step 3: Setting the Stop Loss (SL)
Placing a stop loss (SL) is mandatory to protect your capital.
- Safe stop-loss point: Set the SL just below the lowest point of the second candle. This is the lowest point of the entire pattern; if price falls below this level, the structure of the Morning Star pattern is invalidated and the reversal signal is no longer valid.
- Alternative stop loss: The SL can also be placed below the lowest point of the entire pattern (including the wicks of candles 1, 2, and 3). This level is usually slightly safer but may increase the stop-loss distance, affecting the risk-to-reward ratio.
Always remember to set your stop loss immediately after entering a trade.
Step 4: Setting the Take Profit (TP)
Defining profit targets (Take Profit – TP) is the final step:
- Using resistance levels: Identify previous key resistance levels on the chart (prior highs, psychological levels, important moving averages). Set the TP at or just below these levels.
- Using the Risk/Reward (R:R) ratio: Determine the distance from the entry point to the stop-loss level (this is the risk). Set the TP so that the potential reward is 1.5, 2, or 3 times the risk (for example, R:R = 1:2 or 1:3). If the risk is 50 pips, the TP would be 100 or 150 pips.
- Using Fibonacci Extension/Retracement: Draw the Fibonacci tool from the low of the downtrend to the first rebound high to identify potential targets (such as the 1.618 or 2.618 extension levels, or retracement levels during a pullback).
- Using a Trailing Stop: As price moves in a favorable direction, you can trail the stop loss to lock in profits already gained. This is an effective strategy for capturing strong bullish moves.
Pros & cons of the Morning Star candlestick
Like any pattern in technical analysis, the Morning Star candle also has its own pros and cons:
Pros:
- Clear reversal signal: It is one of the strongest and most easily recognizable bullish reversal patterns when it appears in the right context.
- Distinct market psychology: The three-candle structure logically reflects the transfer of control from bears to bulls.
- Clear entry and exit points: It helps identify relatively precise entry points and stop-loss levels, supporting effective risk management.
- High applicability: The pattern can be used across multiple markets (Forex, stocks, commodities, cryptocurrencies) and on various time frames.
Cons:
- Not always accurate: The pattern can fail, especially when there is no confirmation or when it appears in an unsuitable market context (such as a sideways market).
- False breakout signals can occur: Price may rise after the pattern forms but then quickly reverse and decline again.
- Requires experience to distinguish variations: In some cases, the pattern may not be perfect (no gaps, or candle bodies not at ideal sizes), requiring experience to properly assess its validity.
- Signal lag: Waiting for the third candle to close and for confirmation may cause you to miss part of the initial bullish move.
Compare the Morning Star candlestick with other patterns
To avoid confusion, consider the comparison below to distinguish the Morning Star candlestick from other common Japanese candlestick patterns:
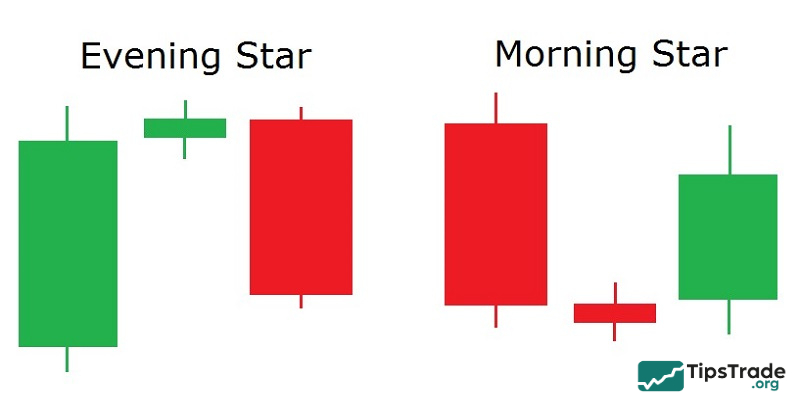
- Morning Star vs. Evening Star: These two patterns are mirror images of each other. The Morning Star is a bullish reversal pattern that appears at the end of a downtrend. The Evening Star is a bearish reversal pattern that appears at the end of an uptrend, with a symmetrical structure: a long bullish candle, a small-bodied candle (gap up), and a long bearish candle (gap down).
- Morning Star vs. Bullish Engulfing: The Bullish Engulfing is a two-candle pattern in which the second candle is a long bullish candle that completely engulfs the preceding bearish candle. The Morning Star consists of three candles, is more complex, and is often considered a stronger signal, especially when gaps are present.
- Morning Star vs. Hammer and Inverted Hammer: The Hammer and Inverted Hammer are single-candle patterns that typically appear at the bottom of a downtrend and signal a bullish reversal. They are simpler than the Morning Star and may form part of the second candle in a Morning Star pattern (if the second candle is a small-bodied Hammer or Inverted Hammer). The Morning Star provides stronger confirmation through its third candle.
Advices when trading the Morning Star candlestick
To trade the Morning Star candlestick successfully, keep the following tips in mind:
- Always wait for confirmation: Never enter a trade based solely on the appearance of the pattern without additional confirmation.
- Combine with other tools: Use technical indicators (RSI, MACD, Volume, Stochastic), support/resistance levels, trendlines, or other chart patterns to increase the reliability of the Morning Star signal. The confluence of multiple signals gives you an edge.
- Trade in context: Assess the overall market context. A Morning Star that forms after a sharp decline and at a key support level is far more reliable than one appearing in a sideways market.
- Strict risk management: Always place a stop loss (SL). Risk only a small portion of your total trading capital on each trade (for example, no more than 1–2%).
- Practice on a demo account: Before trading with real money, practice identifying and trading the Morning Star candlestick on a demo account to become familiar with it and build confidence.
- Keep a trading journal: Record the trades you take based on the Morning Star candlestick. Analyze the results to learn from both winning and losing trades.
- Be patient: At times, you may miss opportunities by being too cautious while waiting for confirmation. However, patiently waiting for clear, confirmed signals will help you avoid many unnecessary losing trades.
Conclusion
The Morning Star candlestick is one of the most powerful reversal patterns, particularly useful for identifying trading opportunities at the end of a downtrend. However, to use it effectively, investors should combine it with other technical tools and apply sound risk management strategies. With proper understanding and correct application, the Morning Star candlestick can become a valuable tool to help improve your trading performance.