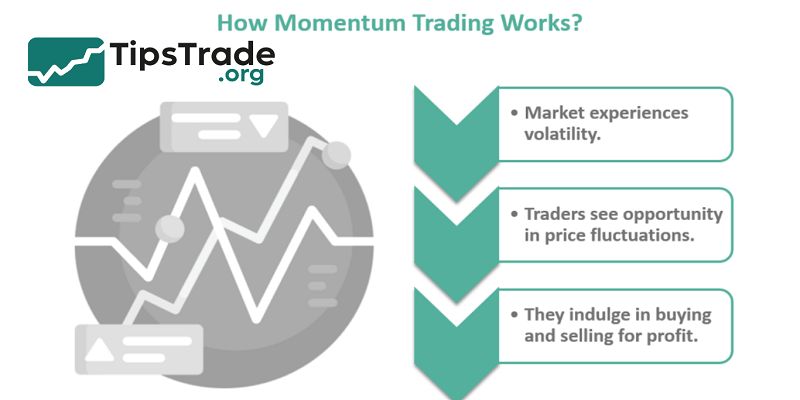
Momentum trading is a strategy based on the idea that assets moving strongly in one direction tend to continue that movement for a period of time. Traders who follow momentum look for accelerating price trends supported by strong volume, sentiment shifts, and volatility expansion. This guide explains how momentum trading works, its core principles, the best indicators, and practical strategies used by real traders. It is written in a clear, people-first style to help beginners and intermediate traders understand momentum without unnecessary jargon. Visit tipstrade.org and check out the article below for further information
What Is Momentum Trading?
Momentum trading is a technique where traders buy assets showing strong upward price acceleration or sell assets with rapid downward momentum. Instead of waiting for trend reversals, momentum traders ride existing strength until signs of exhaustion appear.
This concept is based on the tendency of markets to move in waves—when price moves quickly in one direction, it often continues due to herd behavior, liquidity imbalances, and institutional flow.
One classic example occurs during earnings releases when a stock breaks its resistance with high volume, attracting more traders and pushing the trend further. Momentum trading differs from mean reversion because it focuses on the continuation of price movements, not the return to an average.
Many traders use a combination of technical indicators, volume analysis, and market structure to identify strong setups.
Because momentum trading relies on timing, traders must act decisively while managing risk appropriately. The strategy works best during high-volatility periods when price moves cleanly in one direction.
How Momentum Trading Works

Momentum trading works by identifying assets where price, volume, and volatility align in a strong directional move.
Traders typically look for breakouts above resistance, breakdowns below support, or price acceleration driven by catalysts like news or earnings.
When market participants react to these events, liquidity surges and the asset experiences rapid movement. Momentum traders enter these moves early and exit when momentum slows.
Volume plays a crucial role: strong momentum almost always comes with above-average trading volume, confirming participation from institutions.
Traders often monitor the rate of change, price patterns, and multi-timeframe alignment to confirm momentum strength.
For example, if the daily chart shows a breakout while the 15-minute chart displays a clean pullback, the setup becomes more reliable. Momentum trading also depends heavily on psychology—fear and greed amplify existing trends, creating opportunities for traders who act quickly.
Successful momentum approaches combine risk control, disciplined entries, and clear exit conditions.
Key Principles of Momentum Trading
Trend Strength & Direction
Trend strength is the foundation of momentum trading. Traders prioritize assets moving in a clear direction rather than chopping sideways.
Tools like moving averages, trendlines, and structure mapping help determine whether a trend is strong enough to trade.
A momentum trader typically looks for higher highs and higher lows in an uptrend or lower lows and lower highs in a downtrend.
Strong trends often come with clean, long candles and minimal pullbacks. Additional confirmation may come from the ADX indicator, where readings above 20–25 signal meaningful strength.
Traders must avoid trading momentum in flat markets because lack of direction leads to false signals. Real-world examples—such as strong tech stock rallies or sharp currency moves after economic releases—show that identifying trend direction early greatly increases profitability.
Volume Expansion
Volume expansion is a critical element in confirming momentum. When an asset experiences rising volume during a breakout or continuation move, it signals broad participation from traders, institutions, and algorithms.
High volume reduces the chance of fakeouts because it reflects genuine market conviction. Many momentum traders monitor relative volume (RVOL) and compare current volume with historical averages.
For instance, a breakout accompanied by volume twice the daily average is far more reliable than one with weak volume.
Volume spikes during catalysts such as earnings, rate decisions, or major news amplify momentum strength.
Volatility & Speed of Movement
Momentum thrives in volatile conditions because rapid price movement provides clear profit opportunities.
Traders often look for assets with expanding volatility—measured through ATR (Average True Range) or implied volatility in options markets. When ATR rises, it signals that the asset is capable of making larger intraday moves.
However, excessive volatility can also lead to slippage or stop-outs, so balance is essential.
Experienced traders prefer controlled volatility where price moves quickly but maintains structure.
Catalysts
Market catalysts often trigger powerful momentum. Examples include earnings beats, economic releases (like CPI or NFP), regulatory announcements, or industry news.
These events create sharp imbalances in supply and demand, causing strong directional movement.
A stock that reports revenue above expectations may rally for several days as institutions accumulate shares.
Likewise, disappointing economic numbers may trigger momentum-driven selloffs in currencies.
Catalysts provide context for why momentum exists and help traders avoid random trades.
Momentum Trading Strategies
Breakout Momentum Strategy
Breakout momentum strategy focuses on entering trades when price breaks above resistance or below support with strong conviction. Traders use volume confirmation to filter out false breakouts.
For instance, if Bitcoin breaks a major resistance level while volume surges, momentum traders consider it a signal to enter long.
Breakout strategies work best during trending markets where liquidity floods in after key levels are breached.
Traders must place stops below breakout points to avoid losses from sudden reversals.
Real-world traders like Mark Minervini popularized this strategy, highlighting the importance of clean price structure and volatility expansion.
Pullback Momentum Strategy
Pullback strategies aim to enter momentum trades at better prices after minor retracements.
When an asset is trending strongly, small dips to moving averages—such as the 20 EMA or 50 EMA—provide opportunities to join the trend without chasing price. Pullbacks typically form flag patterns, bull traps, or shallow reversions.
Traders wait for confirmation such as bullish candles, volume upticks, or break of micro-structure before entering. This strategy reduces entry risk and improves reward-to-risk ratios.
Moving Average Momentum Strategy
Many momentum traders use moving averages to time entries and exits. The 20 EMA identifies short-term trend direction, while the 50 EMA shows intermediate strength.
When price stays above these moving averages, it signals strong bullish momentum. Crossovers like the golden cross (50 crossing above 200) often attract institutional attention.
Traders enter trades when price retests moving averages during strong trends. This strategy simplifies decision-making and works well for beginners.
Price-Action Momentum Strategy
Price-action momentum strategies rely on patterns rather than indicators. Traders look for flags, pennants, impulse waves, and consolidation breakouts.
These patterns demonstrate healthy trend continuation and provide clean entry signals. For example, a bull flag following a strong impulse move often leads to significant continuation when it breaks upward.
Price-action traders use candlestick confirmation—such as engulfing patterns or long-wick rejections—to time entries.
Intraday vs Swing Momentum Trading
Momentum can be applied intraday or across multiple days. Intraday traders focus on fast moves triggered by news or opening volatility.
They use short timeframes such as 1-minute, 5-minute, or 15-minute charts. Swing traders look for daily or 4-hour momentum and hold positions longer.
Swing momentum is more stable and requires fewer decisions.
Each approach requires different risk management and psychological discipline.
Best Momentum Indicators

RSI (Relative Strength Index)
- RSI helps traders identify overbought or oversold momentum conditions. While many people use RSI for reversals, momentum traders use high RSI (>60) as a sign of strength.
- When RSI maintains elevated levels, it indicates sustained bullish momentum.
- In downtrends, RSI under 40 signals strong bearish pressure. RSI also helps identify divergence, which warns of momentum weakening.
MACD (Moving Average Convergence Divergence)
- MACD is one of the most popular momentum indicators.
- Traders monitor MACD histogram acceleration, signal line crossovers, and zero-line shifts.
- When histogram bars increase consistently, it reflects growing momentum.
- MACD works well in trending markets and pairs effectively with moving averages.
Momentum Oscillator
- The Momentum Oscillator directly measures the rate of price change. When values rise rapidly, it shows accelerating momentum.
- This indicator is straightforward and effective for spotting early momentum shifts.
- It is especially useful in forex and commodities.
Rate of Change (ROC)
- ROC highlights how fast price is moving relative to previous periods.
- High positive ROC values indicate bullish momentum, while negative values signal bearish acceleration.
- Traders combine ROC with trendlines to confirm breakouts.
Moving Averages
- Moving averages smooth price action and reveal underlying momentum direction. Short EMAs like 20 identify immediate trend speed.
- Longer EMAs like 50 and 200 help traders avoid counter-trend trades.
Volume Indicators (OBV, VWAP)
- Volume-based indicators enhance momentum confirmation. OBV (On-Balance Volume) shows accumulation or distribution trends.
- VWAP is widely used by institutions; price above VWAP signals bullish intraday momentum.
How to Identify Momentum in the Market
Momentum identification involves analyzing price direction, volatility expansion, and volume confirmation. Traders look for decisive breakouts, long-bodied candles, and sequences of higher highs or lower lows.
Volume spikes are essential: strong momentum almost always correlates with above-average participation.
Using multi-timeframe analysis can validate signals; for example, if the daily chart shows an uptrend while the 1-hour chart confirms a breakout, the momentum becomes more reliable.
Traders also watch for correlated market moves; when entire sectors or currencies move in one direction, momentum tends to strengthen.
Tools like ATR reveal whether volatility is expanding enough to support momentum trades. Identifying momentum requires patience, but once recognized, it provides high-probability opportunities.
Pros and Cons of Momentum Trading

Advantages
- Momentum trading offers high return potential because traders capitalize on fast price movements.
- Trends supported by news or institutional flow often move quickly, allowing traders to profit in short periods.
- Another advantage is clarity—momentum setups are easier to see compared to complex reversal patterns.
- When volume, price, and volatility align, the signals become straightforward. Momentum strategies work across all markets and timeframes.
Disadvantages
- Momentum strategies carry significant risk. Fast-moving markets can reverse unexpectedly, leading to stop-outs.
- Traders may also experience psychological pressure because decisions must be made quickly.
- Chasing price—one of the most common mistakes—causes losses when trends fade. Momentum works poorly in sideways markets where breakouts often fail.
Common Mistakes in Momentum Trading

Many traders lose money because they chase prices instead of waiting for confirmation. Another mistake is ignoring volume, which often leads to entering false breakouts.
Traders sometimes rely too heavily on indicators without considering market context. Overusing leverage magnifies losses in fast-moving markets.
Poor risk management—such as not setting stop losses—results in significant drawdowns. Some traders also trade against larger trends, expecting reversals that never happen. Successful momentum trading requires patience, discipline, and consistent risk control.
Risk Management for Momentum Traders
Risk management is essential due to the fast nature of momentum markets. Traders use stop losses to limit damage if momentum fades.
Position sizing determines how much capital is at risk; many experts recommend risking no more than 1–2% per trade.
Reward-to-risk ratios help evaluate whether a trade is worth taking. Avoiding overtrading prevents emotional mistakes.
Traders also benefit from journaling trades to identify patterns of success and failure. Strong risk control provides stability and long-term sustainability.
Conclusion
Momentum trading is essential as a strategy because it enables traders to capitalize on market trends by buying assets showing strong price momentum and selling before the trend reverses. This approach aims at maximizing short-term gains by riding the continuation of price movements, relying on technical indicators such as volume and volatility. Understanding momentum trading helps traders improve timing for entry and exit, enhancing profitability while managing risks effectively.

