
The Momentum indicator is a popular technical analysis tool used by many traders to measure market momentum. It helps them identify the strength of price trends, thereby seeking potential trading opportunities and managing risks more effectively. In this article, Tipstrade.org will provide you with useful knowledge and trading strategies to make the most of the power of the Momentum indicator.
What is a momentum indicator?
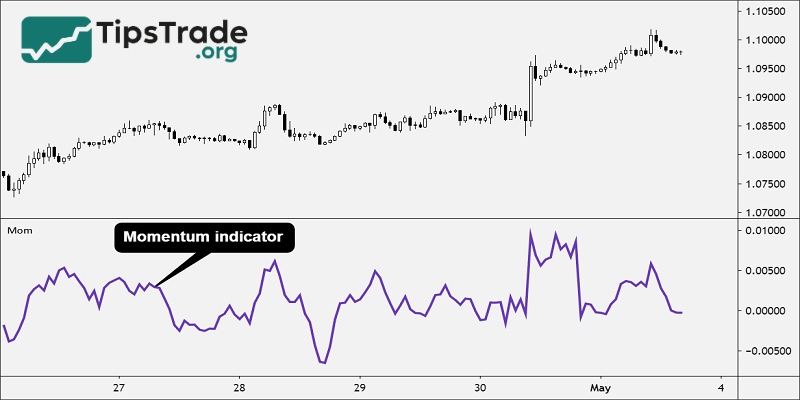
The Momentum Indicator (abbreviated as MOM) is a tool that measures the speed of price change. It assesses the strength of an uptrend or downtrend over a given period of time. In other words, Momentum indicates how fast or slow the price is moving. The indicator usually oscillates around a center line, usually 0 or 100. The position and direction of the Momentum line provide important signals about the trend.
When the Momentum line is rising, it indicates that the bullish momentum is strong. Conversely, when the Momentum line is falling, the bearish momentum is dominant. Notably, this indicator does not have a fixed upper or lower limit. This is different from other oscillators such as RSI or Stochastic. This flexibility requires investors to have a unique approach when interpreting the signals.
>>See more:
- Understanding RSI indicator: A Beginner’s Guide
- What is the MACD Indicator and How to Use It?
- The ADX Indicator: What Is It And How To Use It?
- A Complete Guide to Using the Stochastic Indicator from A–Z
The importance of momentum in technical analysis
Momentum is a core element of technical analysis. It reflects the intrinsic strength of a price trend. When momentum increases, the current trend is likely to continue. Conversely, when momentum weakens, it can be an early sign of a reversal. Capturing momentum helps investors react more quickly to changes. It can also provide a competitive advantage in the market.
Furthermore, momentum also helps confirm signals from other indicators. For example, a buy signal from a candlestick chart will be more reliable if it is accompanied by increasing momentum. Similarly, a sell signal will be stronger when momentum begins to decrease. Understanding the importance of momentum is the first step to using the Momentum indicator effectively.
How does the momentum indicator work?
The Momentum indicator works by comparing the current price with the price of previous periods. When the current price is higher than the price of the previous period, the Momentum will increase. This shows that the bullish momentum is getting stronger. Conversely, when the current price is lower, the Momentum will decrease. This signals that the bearish momentum is dominant in the market.
One notable feature is the sensitivity of Momentum to rapid price movements. It can generate signals earlier than lagging trend indicators. However, this also means that there can be many noise signals. Understanding these features helps investors know how to adjust and combine Momentum. It helps optimize trading efficiency. This indicator is not just a calculation, it is also a reflection of the forces of supply and demand. It is affecting the market at each moment.

Comparing the momentum indicator with other common momentum indicators
To see the value of Momentum, we need to compare it to other momentum indicators. Each has its own advantages and interpretations.
- Momentum Indicator: Measures the rate of change in price. No upper/lower limits. Very sensitive to price fluctuations.
- Relative Strength Index (RSI): Measures the strength of bullish and bearish price movements. Ranges from 0-100. Helps identify overbought/oversold areas.
- Moving Average Convergence Divergence (MACD): Is a trend following and momentum indicator. Consists of two lines (MACD line and Signal line) and a histogram. Helps determine the strength, direction, momentum and duration of a trend.
- Stochastic Oscillator: Compares the closing price to the price range over a given period. Ranges from 0-100. Also identifies overbought/oversold areas and divergence signals.
Momentum stands out for its simplicity and visual appeal. It focuses on the absolute or relative rate of change in price. Other indicators can be more complex. However, they provide additional information on overbought/oversold levels or moving average crossovers. Understanding the strengths of each indicator helps investors choose the right tool.
Formula for calculating the momentum indicator
The Momentum indicator is calculated using the following formula:
Momentum Indicator = CLOSE (n)/CLOSE (n-X)
Where:
- CLOSE (n): Represents the closing price of the most recent bar.
- CLOSE (n-X): Represents the closing price X periods ago.

For example: The S&P 500 Index closes today’s trading session at the price of 2750.
- If the S&P 500 Index had closed 10 sessions ago at the price of 2700, the difference would have been positive: +50 (2750 – 2700).
- If the S&P 500 Index had closed 10 sessions ago at the price of 2800, the difference would have been negative: –50 (2750 – 2800).
How to read the momentum indicator
There are 2 MOM indicator levels commonly used to measure price levels as follows:
- MOM indicator > 100: Current price is higher than the price of “n” previous trading sessions.
- MOM indicator < 100: Current price is lower than the price of “n” previous trading sessions.
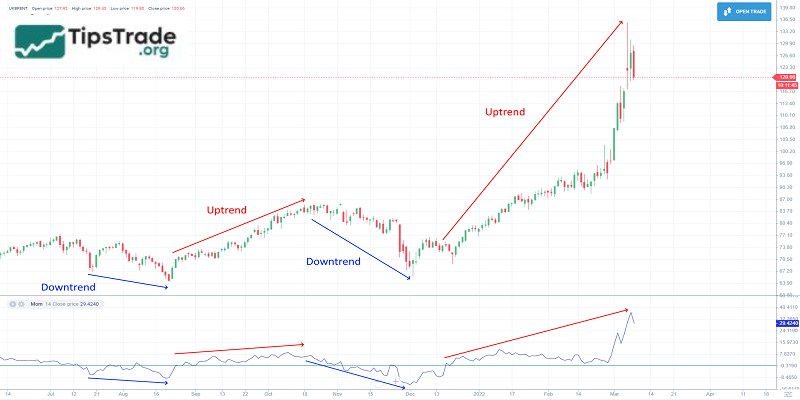
If the MOM line is above the 100 reference level and the distance is large, it indicates a stronger upward trend. Conversely, if the MOM line is below the 100 reference level and the distance is large, it shows that the downward trend is accelerating.
Using the momentum indicator in trading
Trade when momentum indicator crosses 100 line
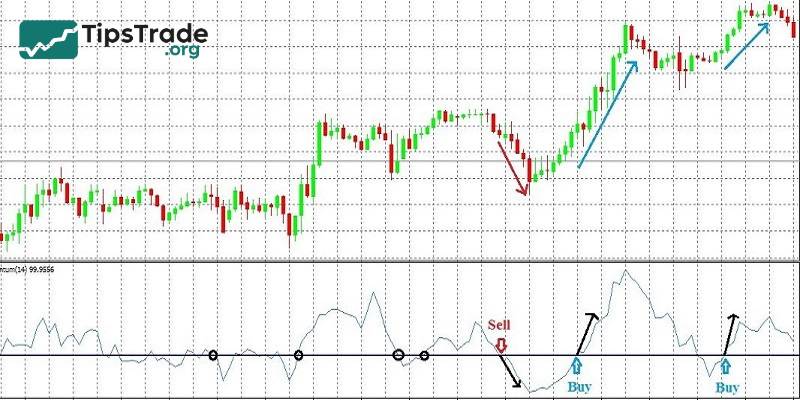
The Momentum indicator always moves either above or below the 100 level.
- When the MOM line moves upward and crosses above the 100 level: This indicates that buyers are gaining control. The market trend is likely to continue upward, making it a good signal for traders to place a Buy order.
- When the MOM line moves downward and crosses below the 100 level: In contrast, this shows that sellers are dominating the market. Prices are likely to continue falling, so traders should consider placing a Sell order.
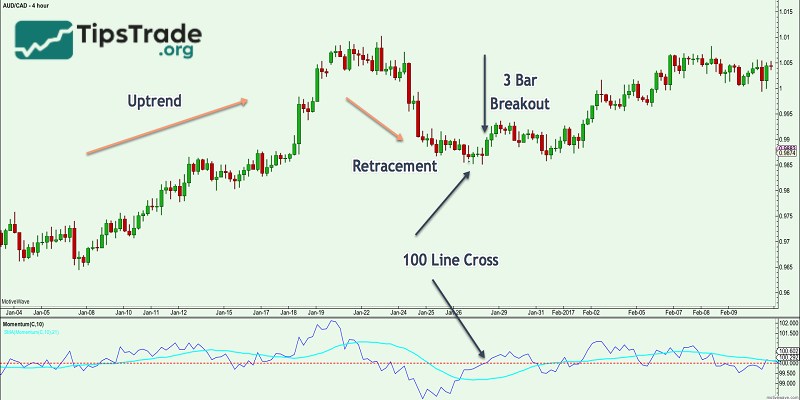
Note: The Momentum line frequently intersects the 100 level, and the signals generated are not always clear. Therefore, to make more accurate trading decisions, traders should combine the Momentum indicator with other technical analysis tools.
Trade when momentum line diverges or converges with price
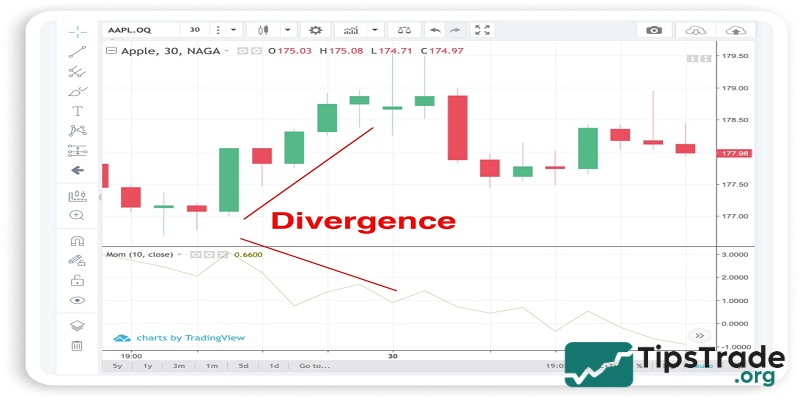
To identify divergence or convergence, you need to observe the highs and lows formed by both the Momentum line and the price chart.
- Divergence: Occurs when the Momentum indicator forms a lower high compared to the previous high, while the price chart forms a higher high than the previous one.
- Convergence: Occurs when the Momentum indicator forms a higher low compared to the previous low, while the price chart forms a lower low than the previous one.
When divergence or convergence appears, traders can anticipate a potential trend reversal. However, signals of trend reversal from divergence or convergence are generally weak. If the price is moving within a strong trend, these signals can be easily distorted or become unreliable.
Therefore, traders should not rely solely on these reversal signals. It is recommended to combine the Momentum indicator with multiple other tools and technical indicators to enhance trading accuracy.
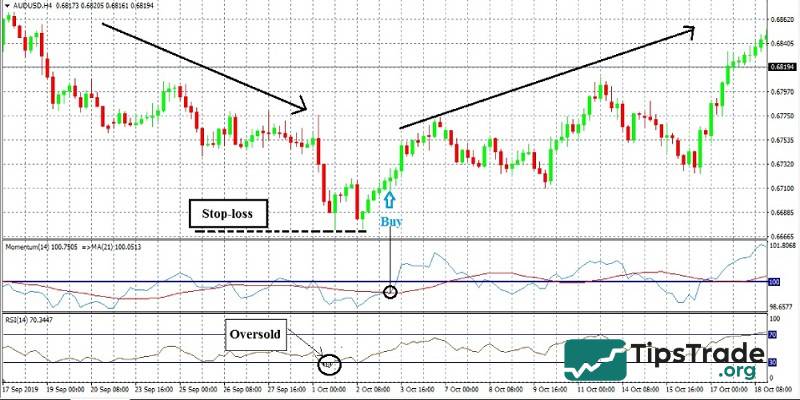
Trade when momentum indicator crosses the Moving Average (MA)
When the MOM indicator and the MA line intersect, it can help investors identify potential price reversal points, signaling the beginning of a new trend. Combining these two indicators allows traders to detect areas where price may reverse and initiate a new trend.
Traders can set the MA with any period they prefer. The most commonly used periods are 9, 14, and 21. The longer the MA period, the smoother and more accurate the signal tends to be.
- If the MOM line moves upward and crosses above the MA line: Traders may consider placing a Buy order.
- If the MOM line moves downward and crosses below the MA line: Traders may consider placing a Sell order.
Pros and cons of momentum indicator effectively
Like any other technical analysis tool, the Momentum Indicator has its own strengths and limitations:
Pros:
- Provides early signals of changes in price momentum.
- Simple, intuitive, and easy to understand.
- Suitable for various market types and timeframes.
- Effective in identifying strong divergence/convergence signals.
Cons:
- Easily generates noise or false signals in a ranging market.
- Lacks fixed overbought/oversold levels, making it harder to identify key zones.
- Often needs to be combined with other indicators to improve reliability.
- May lag in markets with sudden price volatility.
Tips for using momentum indicator
Here are some helpful tips to help traders use momentum indicators most effectively:
- When choosing a timeframe to trade, you should not use periods shorter than 30 minutes or add additional filtering parameters. The reason is that the MOM indicator often generates many false trading signals.
- It is necessary to consider the average volatility of the chosen trading instrument.
- When opening a trade, it is best to set your stop loss at the nearest swing high or swing low on the selected chart.
- In particular, you should also pay attention to the state of the market before the momentum appears. Because, the speed of the price movement after that will be proportional to the strength and size of the next correction.
Conclusion
The Momentum indicator provides valuable information, assisting traders in making accurate trading decisions. By effectively utilizing Momentum analysis methods combined with a strict risk management strategy, traders can significantly improve trading performance and maximize potential profits. Wishing all traders successful trading!
See more: