

MFI vs RSI: Which is better? is a topic that attracts significant attention from traders who are looking for effective technical indicators to analyze financial markets. Both indicators belong to the momentum category and are widely used in Forex, stock, and cryptocurrency trading. However, each indicator has its own calculation method and provides trading signals in different ways. So, what are the differences between MFI vs RSI, and which indicator is more suitable for your trading strategy? Let’s explore the details in the article below.
What is the Money Flow Index (MFI)?
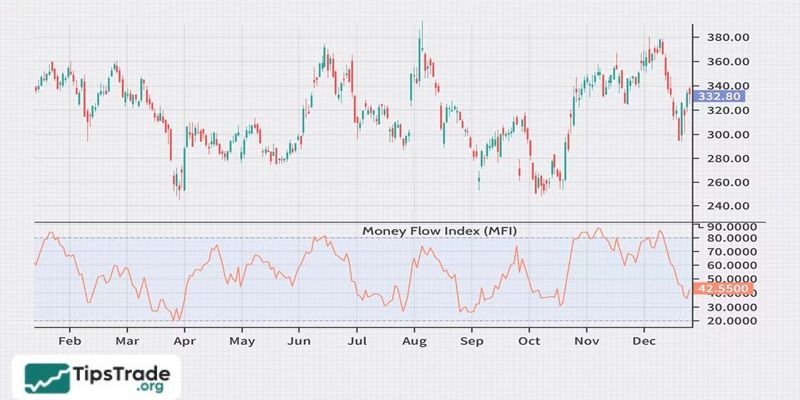
The Money Flow Index (abbreviated as MFI) is a momentum indicator that measures the strength of money flowing into and out of a currency pair. It takes into account both price and trading volume to determine whether an asset is in an overbought or oversold condition.
The MFI indicator is calculated using typical price and trading volume. It gives values between 0 and 100.
- If the MFI value is above 80, the asset is overbought (possible selling opportunity).
- If the MFI value is below 20, the asset is oversold (possible buying opportunity).
See more:
- How to use Accumulation/Distribution Line for getting trading signals
- Bollinger Bands – An effective technical indicator for investment trading!
- Compare MACD vs RSI: Which Indicator is Better for Your Trading Strategy?
- What is the CCI indicator? Formula for calculating CCI in technical analysis
What is the Relative Strength Index (RSI)?
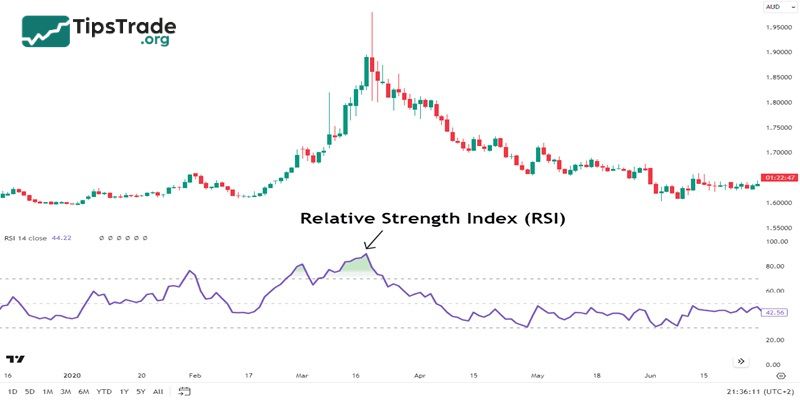
The Relative Strength Index (abbreviated as RSI) is another momentum indicator that helps traders measure price strength by comparing the magnitude of recent gains to recent losses. RSI is based only on price changes (not volume). It also ranges from 0 to 100.
- RSI above 70 means an asset is overbought.
- It is below 30 means an asset is oversold.
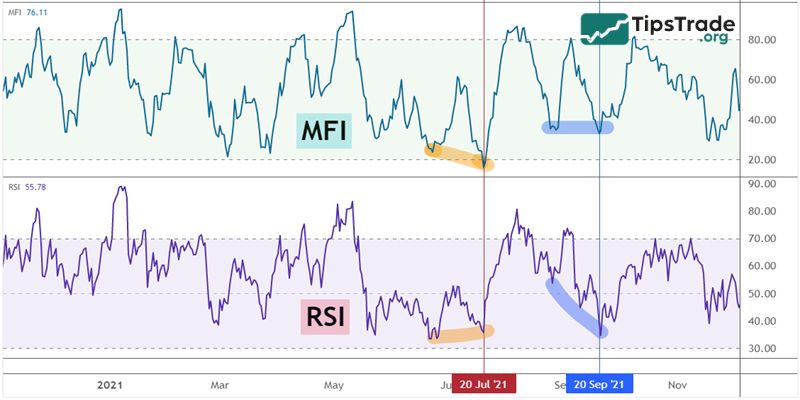
Comparing MFI vs RSI: Key Differences
Knowing the differences between MFI vs RSI can influence trading strategies. These indicators have distinct features that impact their effectiveness under different market conditions.
| Feature | MFI | RSI |
|---|---|---|
| Primary Focus | Price and volume | Price only |
| Default Period | 14 days | 14 days |
| Overbought Level | 80 | 70 |
| Oversold Level | 20 | 30 |
| Signal Generation | More frequent | More selective |
| Early Reversal Signals | Stronger | Moderate |
| False Signal Risk | Higher due to volume reliance | Lower |
| Best Use Case | Detecting reversals early | Analyzing momentum |
Advantages and disadvantages of using MFI
Advantages of using MFI
- Includes volume: Unlike RSI, MFI factors in trading volume, making it a more comprehensive momentum indicator. This additional data helps traders get a clearer picture of market strength and ensures they do not make decisions based solely on price movements.
- More accurate overbought/oversold signals: The MFI indicator’s thresholds at 80 and 20 provide more reliable overbought and oversold signals. Since volume is included in the calculation, it helps reduce false signals that might occur with RSI, leading to better decision-making in forex trading.
- Works well in volatile markets: MFI is especially useful in highly volatile forex markets where prices fluctuate rapidly. It can help traders avoid false breakouts and whipsaws by confirming whether price movements are supported by real money flow.
Disadvantages of using MFI
- More complex calculation: The MFI formula involves multiple steps, including typical price, raw money flow, and money flow ratio calculations. Beginners may find it harder to understand compared to RSI, which is simpler and more straightforward.
- Less effective in low-volume markets: Since MFI depends on volume, it may not be useful in forex pairs with low trading activity. In such markets, the volume component might not provide meaningful insights, making MFI less reliable.

Advantages and disadvantages of using RSI
Advantages of using RSI
- Easy to use: RSI has a simple calculation and is easy to interpret, making it ideal for beginners. Traders only need to look at the 70 and 30 levels to determine overbought and oversold conditions, without worrying about volume data.
- Quickly identifies market conditions: RSI provides fast signals about potential price reversals. Traders can quickly spot whether an asset is overbought or oversold, allowing them to make timely trading decisions.
- Works well with other indicators: RSI pairs effectively with moving averages, Bollinger Bands, and support/resistance levels. Combining RSI with other technical tools increases its accuracy and helps traders avoid misleading signals.
Disadvantages of using RSI
- Ignore volume: Unlike MFI, RSI only considers price movement. This means RSI can sometimes generate false signals, especially when market volume does not support price changes. Traders might enter trades based on misleading signals if they rely solely on RSI.
- Less reliable in high volatility: During extreme market movements, RSI can give premature or misleading signals. In highly volatile forex pairs, RSI might indicate an overbought or oversold condition too early, leading traders to exit trades prematurely or enter losing positions.

MFI vs RSI: Which is better?
It’s really hard to give a precise answer to this question. In actual trading, it depends on your trading approach and strategy. Both MFI vs RSI have their strengths and weaknesses, so choosing the right one depends on your needs:
- If you prefer volume-based signals: MFI is the better choice since it includes trading volume, offering a more accurate view of market strength.
- If you want quick price trend signals: RSI is ideal for traders who want a fast and simple way to spot overbought and oversold conditions.
- If you want to confirm signals: Using both MFI and RSI together can improve accuracy. MFI confirms whether volume supports price movement, while RSI gives clear overbought/oversold signals. This combination helps reduce false signals and improves trading decisions.
FAQs about MFI vs RSI
- Can I use MFI vs RSI together? Yes! Many traders use MFI and RSI together to enhance signal accuracy. When both indicators confirm a trade signal, it reduces the chances of false alerts and increases the probability of a successful trade.
- Is MFI more accurate than RSI? MFI can be more accurate because it considers both price and volume, giving a more detailed picture of market trends. However, RSI is simpler and faster to interpret, making it a preferred choice for traders who want quick insights.
- Which indicator is best for beginners? RSI is better for beginners since it is easier to understand and apply in forex trading. The overbought and oversold levels at 70 and 30 make it simple to use, even for traders with little experience.
- Do professional traders use MFI vs RSI? Yes, professional traders use both MFI vs RSI, often combining them with other indicators like moving averages, Bollinger Bands, and MACD. This combination enhances signal accuracy and provides a well-rounded market analysis.
The above is the complete article discussing the topic “Comparing MFI vs RSI indicators: Which is better?“. Hopefully, the information about MFI vs RSI in this article will help you better understand these two indicators and choose the most suitable tool to optimize your trading strategy.
See more: