
The MFI indicator assists traders in assessing the strength of cash flow in financial markets. However, is this tool truly effective in identifying trends and predicting price reversals? Are overbought or oversold signals from the MFI reliable? In this article, Tipstrade.org will provide a detailed analysis of how to calculate and use the MFI indicator in trading, from there can help traders build more effective trading strategies.
What is the MFI indicator?
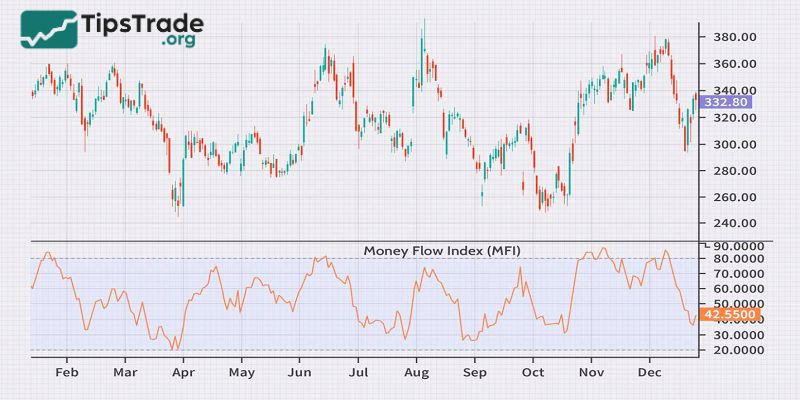
In the field of technical analysis, the MFI (Money Flow Index) indicator has emerged as a powerful tool, assisting investors in measuring the strength of money flow in the market. The application range of the MFI indicator is very diverse, spanning from Forex currency pairs and commodities to stocks.
The MFI fluctuates on a scale from 0 to 100, providing users with important signals such as overbought/oversold areas, divergences (convergence or divergence), and potential price trends. However, many professional traders find the MFI’s ability to identify long-term trends to be limited. Therefore, MFI is often used to supplement market trend identification rather than as the primary tool.
Developed by Gene Quong and Avrum Soudark, the MFI indicator was created based on the foundation of the RSI (Relative Strength Index) indicator. The main difference is that the MFI incorporates trading volume, making it considered a ‘volume-weighted RSI’ version.
According to the authors, trading volume often spikes at market peaks or troughs. Focusing solely on price fluctuations while ignoring volume can cause investors to miss early signals of trend changes.
The introduction of the MFI partially addresses this drawback of the RSI, providing a more comprehensive and detailed overview of market dynamics. Thanks to MFI, traders can detect unusual signs of cash flow, or the involvement of large institutions, often referred to as ‘whales’, in the financial market.
>>See more:
- OBV Indicator: How to Use It for Effective Trading Strategies
- What is the ROC Indicator and How to Use It in Trading?
- The ADX Indicator: What Is It And How To Use It?
- What is the CCI indicator? Formula for calculating CCI in technical analysis
How to calculate MFI indicator?
The MFI (Money Flow Index) indicator is calculated in four main steps:
- Compute the typical price for a period
Typical Price = (Low + High + Close) / 3
If the typical price for today is higher than yesterday, it implies a positive money flow. If the typical price is lower, it implies a negative money flow. The aggregate of positive money over certain periods gives positive money flow, and the aggregate of negative money over certain periods gives negative money flow.
- Compute the raw money flow
Raw Money Flow = Volume x Typical Price
- Compute the money ratio
Money Ratio = 14-period Positive Money Flow / 14-period Negative Money Flow
- Compute the Money Flow Index (MFI)
Money Flow Index (MFI) = 100 – [100 / (1 + Money Ratio)]
How to use the MFI indicator in trading effectively
Investors can apply the MFI indicator to the financial market as follows:
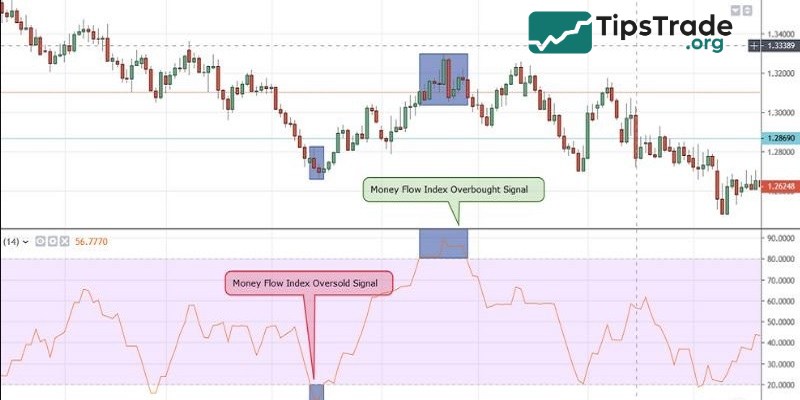
Use the MFI to identify overbought/oversold levels
- If the MFI exceeds a score of 80, this signals that the market is currently overbought, and investors should consider placing a buy order. This signal indicates that the asset price is showing signs of increasing and buyers are in control.
- Conversely, if this index is below 20, investors should consider placing a sell order for that asset because the sellers are currently in control and the selling pressure is very high.
- If the MFI value is 0 or 100, you are most likely experiencing an overbought or oversold market condition. At that time, the asset’s reversal potential is very high. However, in reality, MFI is rarely 0 or 100, so people will prioritize choosing the 20 or 80 mark for determination.
- Besides, the 50-point mark is often used by many investors as a boundary line to determine whether the market trend is rising or falling.
- If the MFI is above 50, it means the market is rising, and vice versa.
Use the MFI to identify divergence/convergence signals
- Divergence occurs when the price sets a higher high than the previous high, while the MFI indicator sets a lower high than the previous high.
- When the price reaches a higher peak, it means the market is still rising. However, if the MFI reaches a lower peak, it indicates that the upward trend is no longer strong and could reverse.
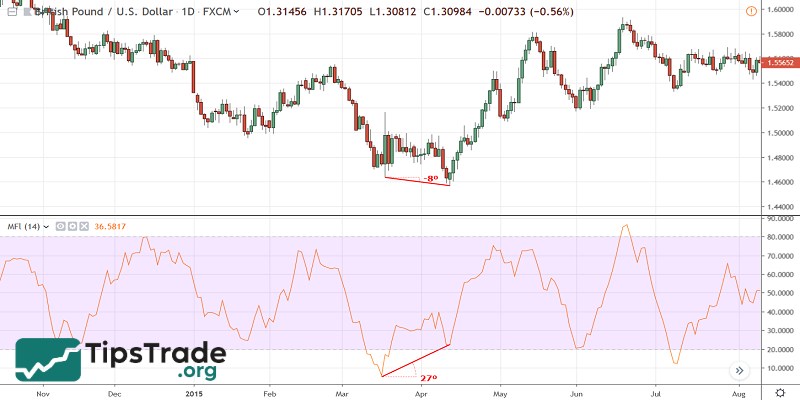
- Convergence occurs when the price sets a lower low than the previous low, but the MFI sets a higher low than the previous low, indicating a bearish divergence. This is a sign of a weakening downtrend, and the market is likely to reverse and move higher.
Convergence or divergence signals only tell us whether the market has the potential to rise or fall; they cannot pinpoint the exact entry point. Therefore, investors should apply additional indicators such as ADX, Parabolic SAR, or the moving average (MA) to overcome the shortcomings of MFI and achieve better analysis results.
Using MFI to identify price trends
First, the investor must set the MFI lines at the 45, 50, and 55 levels. Then it can be done as follows:
- When the MFI line is above 50, the price of the asset tends to increase.
- Conversely, when the MFI line is below 50, the price of the asset tends to decrease.
Using the 45 and 55 markers is similar, but this signal is still quite weak and not reliable enough. Investors should use a combination of MA lines, the ADX indicator, and the Parabolic SAR indicator for more accurate results.
Pros and cons of the MFI indicator
Pros of the MFI indicator
- Combining price and trading volume: Unlike many other indicators, MFI is not solely based on price; it also incorporates trading volume.
- Early signal detection: MFI can help detect early signals of trend changes, especially when there is divergence between the MFI and price.
- Identifying overbought/oversold zones: MFI helps identify overbought and oversold zones, indicating when the market may be “overbought” or “oversold.”
Cons of the MFI indicator
- Noise signals: MFI can generate noise signals, especially in highly volatile markets or during unexpected news events.
- Lag: The MFI is a lagging indicator and may not reflect market changes in a timely manner.
- Should not be used independently: MFI should not be used independently but should be combined with other technical indicators and fundamental analysis to make effective investment decisions.
Conclusion
The MFI indicator is an important tool in technical analysis, supporting traders in assessing cash flow and identifying trading signals based on overbought/oversold zones, divergence/convergence, and price trends. Mastering the characteristics, calculation formulas, and usage of this indicator will help investors apply it effectively, optimize their trades, and limit risks. Wishing all investors success!
See more: