Market Trend Resources is essential for any trader or investor. Price movements rarely move randomly — markets tend to develop bullish, bearish, or sideways trends. Identifying these trends early can help you make better trading decisions, reduce risk, and maximize profit potential. Market trend resources encompass tools, indicators, and information platforms that enable traders to track price action, confirm trends, and anticipate reversals. Visit tipstrade.org and check out the article below for further information
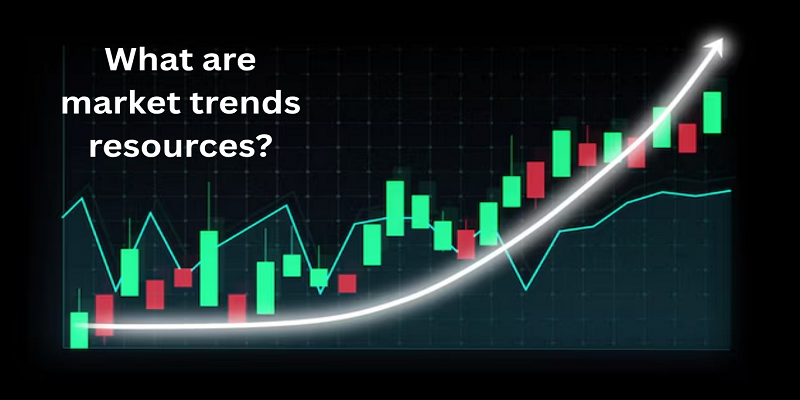
What are market trends resources?

Definition and Types of Trends
Market trends describe the general direction in which the price of an asset moves over time. There are three primary types of trends:
- Bullish trends: Prices consistently rise, marked by higher highs and higher lows.
- Bearish trends: Prices consistently fall, showing lower highs and lower lows.
- Sideways trends (consolidation): Prices fluctuate within a range, showing neither clear upward nor downward movement.
For example, during the 2020–2021 tech stock rally, major technology indices like NASDAQ showed a strong bullish trend, while crude oil experienced a bearish trend during the same period.
Recognizing trend types helps traders apply the right strategies, including trend-following, breakout trading, or range-bound tactics.
Why Understanding Trends Matters for Traders and Investors
Understanding market trends allows traders to align their strategies with the prevailing market direction, reducing the risk of counter-trend trades.
Trend analysis helps investors identify entry and exit points, manage risk, and anticipate potential reversals.
Experience shows that trend-following strategies often outperform random trading. For instance, many mutual fund managers use moving averages and trend indicators to decide long-term positioning.
Traders also rely on trend identification to determine whether to buy, sell, or hold assets. By combining trend resources with proper risk management, one can increase the likelihood of consistent trading success.
>>See more:
- Uptrend: Meaning, Signals, and How Traders Use It In Real Market Conditions
-
What are market trends? 3 ways to accurately identify market trends
-
Downtrend provides opportunities for traders to profit through short selling strategies
-
What Is a Sideways Trend? Definition, Causes, and How Traders Profit from It
Key Resources to Track Market Trends
Trend Indicators
Technical indicators are fundamental tools for tracking trends:
- Moving Averages (MA): Smooth price data to identify trend direction. 50-day and 200-day MAs are widely used for medium- and long-term trends.
- MACD (Moving Average Convergence Divergence): Shows momentum changes and potential trend reversals.
- RSI (Relative Strength Index): Highlights overbought or oversold conditions, confirming trend strength.
Traders often combine these indicators to filter out noise and confirm trends. For instance, if a stock trades above its 50-day MA and MACD is bullish, it suggests a strong upward trend.
Price Action and Candlestick Patterns
- Price action analysis involves interpreting raw price movements without relying solely on indicators.
- Candlestick patterns like hammer, engulfing, and doji can reveal trend continuation or reversal.
Example: A bullish engulfing candle after a sideways consolidation suggests a potential trend reversal upward.
Traders who focus on price action often combine it with trend indicators for higher confidence before entering trades.
Market Breadth Tools
Market breadth measures how many stocks move in a particular direction relative to the overall market. Key tools include:
- Advance/Decline Line: Tracks the number of advancing vs declining stocks.
- TRIN (Arms Index): Compares volume of advancing and declining stocks, showing overall market sentiment.
Market breadth provides insight into whether a trend is supported broadly or driven by a few assets, helping traders avoid false signals.
Economic Calendars and News Feeds
Economic indicators, central bank announcements, and news events often initiate or accelerate trends. Reliable sources include:
- Economic calendars: Forex Factory, Investing.com
- News feeds: Bloomberg, CNBC, Reuters
Traders integrate these resources to anticipate trend triggers and avoid entering positions just before volatile events.
How to Use Market Trend Resources Effectively

Combining Multiple Indicators
Relying on a single resource can be risky. Combining moving averages, MACD, RSI, and price action enhances trend accuracy.
- Confirm trend direction with MA
- Use MACD for momentum validation
- Apply RSI to avoid overbought/oversold traps
Example: If S&P 500 is above its 200-day MA, MACD is bullish, and RSI is neutral, traders may enter long positions with higher confidence.
Identifying Trend Reversals and Continuations
Resources like trend indicators, volume, and candlestick patterns help distinguish true trend reversals from temporary pullbacks.
- Reversal signals: MACD crossover, RSI divergence, trendline breaks
- Continuation signals: Pullbacks near MA or support zones, high volume on breakouts
A Forex trader may notice EUR/USD bouncing off 1.1800 support while volume increases, indicating trend continuation rather than reversal.
Using Trend Resources Across Different Markets
Trend analysis is universal but requires market-specific adjustments:
- Stocks: Focus on MA, MACD, and market breadth
- Forex: Emphasize trendlines, RSI, and economic news
- Crypto: Use volume, candlestick patterns, and MA for high volatility
Example: BTC/USD breakout with high volume confirms a crypto bullish trend, while the same MA strategy works for Apple stock.
Advanced Trend Analysis Techniques

Trendlines and Channels
Drawing trendlines connects swing highs and lows, forming channels that visualize trend direction.
- Uptrend channel: Connect higher lows and highs
- Downtrend channel: Connect lower highs and lows
Channels help traders identify support/resistance within trends and plan entries or exits.
Fibonacci Retracement and Extensions
Fibonacci ratios identify potential trend pullback and extension levels.
- Retracement levels: 38.2%, 50%, 61.8%
- Extension levels: Project potential targets after breakout
Traders often use Fib levels with trendlines or MA for confirmation.
Volume-Based Trend Confirmation
Volume spikes often accompany strong trends.
- Rising price + high volume → strong uptrend
- Falling price + high volume → strong downtrend
Example: Tesla’s stock rally in 2021 showed trend validation through volume spikes, confirming the continuation of bullish momentum.
Sentiment Analysis Tools
Investor sentiment tools include:
- Put/Call ratios
- Fear & Greed Index
- Social media sentiment tracking
Sentiment data helps predict trend sustainability or potential reversals by measuring crowd behavior.
Real Examples of Using Market Trend Resources
Stocks
- Apple stock consistently tested its 50-day MA during the 2020–2021 rally.
- Combining MA, MACD, and RSI allowed traders to confirm bullish trends and enter positions near support zones.
Forex
- EUR/USD trend analysis using trendlines and MACD in 2021 indicated continuation of the uptrend after pullbacks, supported by economic calendar events like ECB policy announcements.
Cryptocurrencies
- BTC/USD trend analysis: Price breaks $40,000 resistance with high volume confirmed by MA and RSI alignment indicated a sustained bullish trend.
Common Mistakes When Using Trend Resources

- Over-reliance on a single indicator
- Ignoring higher timeframes
- Trading without volume or confirmation
- Entering counter-trend positions impulsively
- Failing to consider news or macroeconomic factors
Avoiding these pitfalls improves the reliability of trend analysis.
Conclusion
Market trend resources provide traders with the tools and insights needed to track, confirm, and anticipate market movements. By combining indicators, price action, volume, sentiment, and real-world examples, traders can increase the probability of success while reducing risk. Mastery of these resources allows for informed decisions across various markets, from stocks and forex to cryptocurrencies. Consistent application, coupled with proper risk management, empowers traders to navigate complex markets confidently and strategically.
>>See more:

