
How to use MACD combined with RSI in trading? Both MACD and RSI are widely used technical indicators in financial market trading thanks to their ability to provide clear signals. So, how exactly is the MACD combined with RSI strategy implemented? Let’s explore the details with Tipstrade.org below!
What is the RSI indicator?
RSI indicator explained
RSI (Relative Strength Index) is an indicator that operates based on the strength of price trends. It measures the level of price volatility over a specific period, providing overbought and oversold signals to help traders determine optimal entry points.
The RSI value always fluctuates between 0 and 100:
- If the RSI moves above 70 → The market is considered overbought and may experience a significant decline in the near future.
- If the RSI moves below 30 → The market is considered oversold and may see a strong increase in the near future.
Characteristics of the RSI indicator
- Range: The RSI indicator fluctuates within a value range of 0 to 100, representing the market’s overbought or oversold levels.
Structure: The structure of the RSI is quite simple and is commonly used with a default period of 14, though the time frame can be freely adjusted. - Signals: Signals from the RSI help determine whether the market is overbought or oversold. When an overbought signal is identified, the market may be experiencing high volatility. Conversely, when an oversold signal is detected, caution is needed for potential price reversals.
- Trend identification: The RSI can also indicate market trends. For example, when the RSI drops from above to below the 50 level, it signals a potential downward trend. Conversely, when the RSI rises from below to above 50, it signals that an upward trend may be starting.
What is the MACD indicator?
MACD indicator explained
MACD (Moving Average Convergence Divergence) is a moving average indicator used to identify the difference between two EMAs (Exponential Moving Averages). By analyzing the interaction between these two EMAs, the MACD helps traders find potential entry points on a price chart.
In practice, the structure of the MACD indicator is not very different from the RSI. The most notable difference is that the MACD oscillates around the zero line and has no fixed upper or lower limits. This allows the MACD to reflect the strength of price trends.
Characteristics of the MACD line
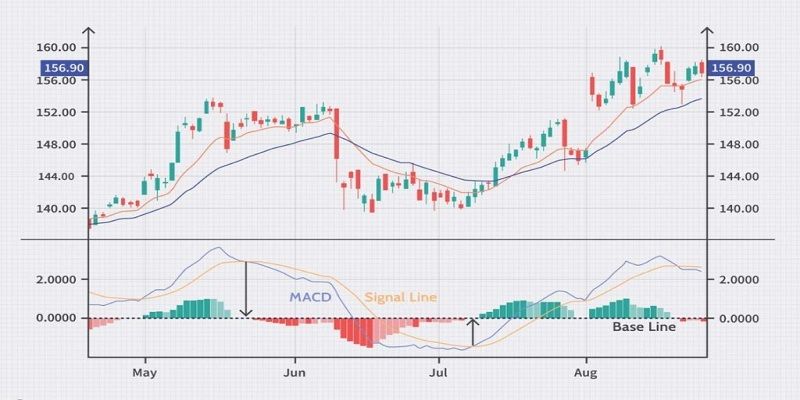
The MACD indicator is composed of the Signal line, the Zero line, and the Histogram. Specifically:
- Signal line and MACD line: These are two moving averages that reflect the direction of price trends.
- Histogram: The histogram measures the degree of divergence and convergence between the two moving averages. This helps investors assess whether the current price changes are occurring quickly or slowly.
- Zero line: This line serves as a reference point for identifying the start of upward or downward trends.
When the MACD line crosses the Signal line, it provides buy or sell signals for investors. Specifically, a crossover from below indicates a buy signal, while a crossover from above indicates a sell signal.
Additionally, investors can identify divergence signals when the MACD line and market price move in opposite directions. This suggests that the market trend is weakening and that a price reversal may occur in the near future.
How to use MACD combined with RSI in trading
Basis for strategy formation
Fundamentally, the strategy MACD combined with RSI is based on the fact that the features and signals of these two indicators can complement each other’s shortcomings.
The MACD is a lagging indicator with very reliable signals and low noise, but it reacts after the market price. On the other hand, the RSI is a leading indicator that tends to move ahead of price but produces signals with higher noise. Therefore, using both indicators together can balance the lag of the MACD with the noisier signals of the RSI.
By combining MACD and RSI, investors can more accurately identify current market trends, avoid opening positions against the trend, and receive warnings about potential reversal signals.
MACD combined with RSI: Step-by-step guides
Required tools:
- Supply and demand zones
- MACD indicator
- RSI indicator
Steps to set up the strategy:
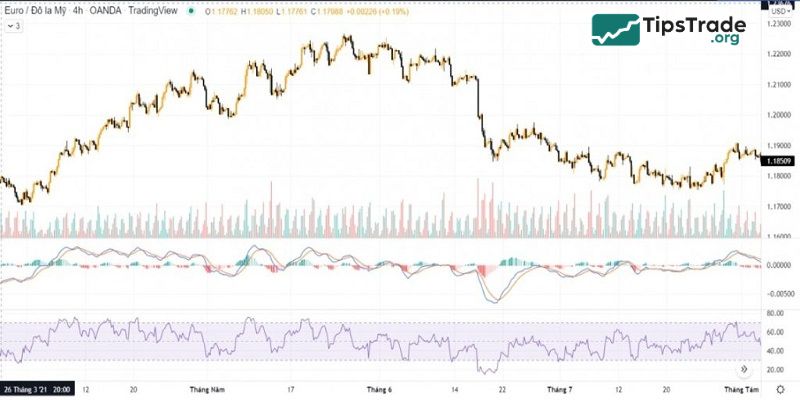
- Open the recommended chart on the H4 timeframe or higher to ensure the accuracy of RSI signals. Using lower timeframes may result in noisy RSI signals.
- Combine the MACD and RSI indicators, using their default parameters.
- Check and identify the current market trend, and draw trendlines.
- Identify levels forming Highs and Higher Highs, or Lows and Lower Lows.
- Check the MACD level. If the MACD is below 0 and shows positive divergence, this is a good buying opportunity. Conversely, if the MACD is above 0 and shows negative divergence, this is a selling opportunity.
- Look for breakout levels and trendline breakouts.
- Check the RSI indicator to determine whether it is starting from the oversold level of 30 (with positive divergence) or from the overbought level of 70 (with negative divergence).
How to execute the strategy:
- Applying the MACD combined with RSI strategy for the SELL position
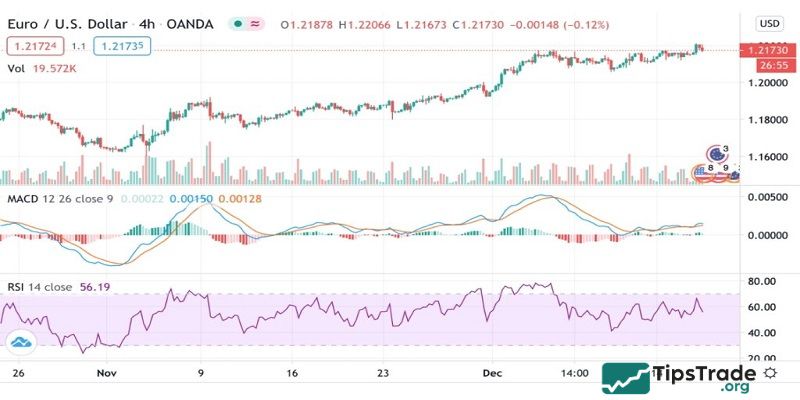
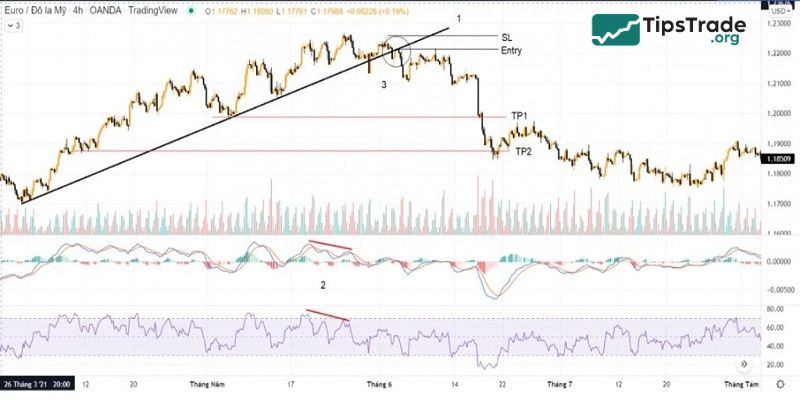
Below are the steps to apply the RSI and MACD combined strategy to enter a Sell position on the EUR/USD H4 chart for reference:
- Identify when the price is approaching a supply or demand zone on a higher timeframe. This helps investors determine the current market trend.
- The MACD signal shows a bearish divergence with the price, and this signal is further confirmed by a bearish divergence from the RSI indicator.
- At this point, investors should wait for a price breakout signal and a break of the trendline. After that, verify the successful breakout by observing candles with narrow price ranges and low volume. If the price fails to move back above the trendline, this is the appropriate time to enter a sell position.
- After identifying the most suitable entry point for the sell position, investors can place the Stop Loss just above the nearest swing high. Profit targets can then be set at previous support levels, with a minimum risk–reward ratio of 1:2 (2R).
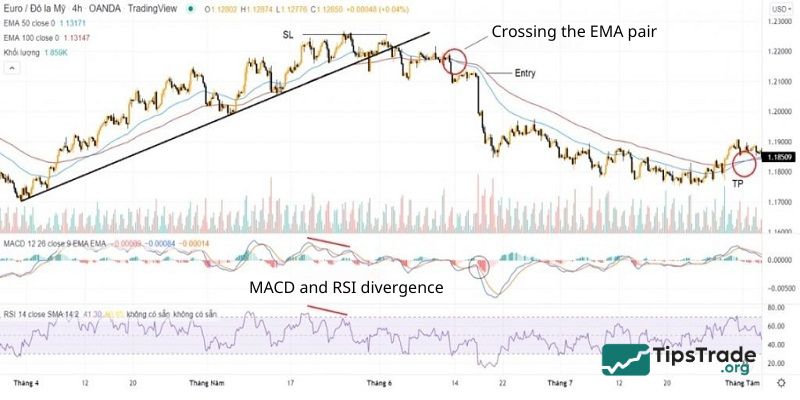
In addition, when identifying trends, investors can also use the crossover of the EMA 50 and EMA 100 to find potential entry points. The process is as follows:
- Use the EMA 50–100 crossover to determine the current market trend. If the EMA 50 crosses above and stays above the EMA 100, it confirms an uptrend in the market.
- After the signals from MACD and RSI appear, the EMA 50 may suddenly cross below the EMA 100. This indicates that the market trend has been broken. Therefore, investors can enter a Sell position when the price retraces near the EMA lines or when the MACD generates a sell signal.
- At this point, investors can set the Take Profit level based on the crossover of the EMA 50 and EMA 100.
- Applying the MACD combined with RSI strategy for the BUY position
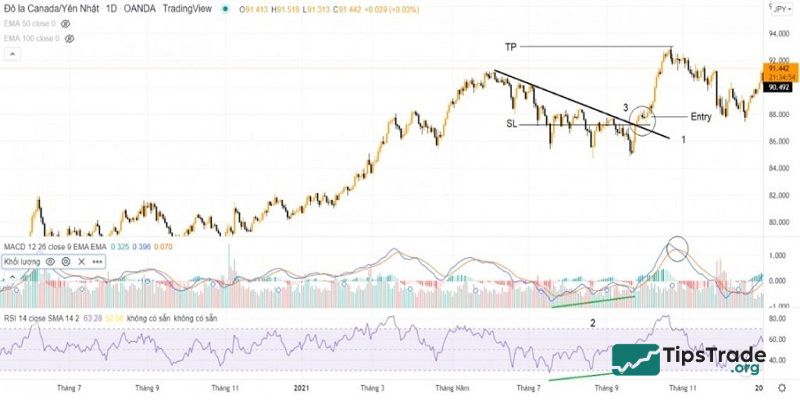
In general, the execution of a Buy position is similar to that of a Sell position; however, the conditions are reversed. Specifically:
- Identify when the price is approaching a supply or demand zone on a higher timeframe. At this point, investors can determine the current market trend.
- Look for a MACD signal showing bullish divergence with the price. This signal should be confirmed by a bullish divergence from the RSI indicator.
- Next, investors should wait for the price to break out of the trendline. Afterward, confirm whether the breakout is valid by identifying a hammer candlestick when the price pulls back to retest the trendline. If the breakout is confirmed, this becomes a buy signal.
- Investors can place the Stop Loss just below the low of the hammer candlestick. The Take Profit level can be set when the MACD generates a sell signal.
Reasons for implementing the MACD combined with RSI strategy
As you can see, the signals generated by the RSI indicator and the MACD line can compensate for each other’s weaknesses. This helps investors predict and identify price trends more accurately within a short period of time.
- The two indicators support each other: Thanks to their ability to provide signals about upcoming price trends, including information about the strength or weakness of those trends, combining RSI and MACD can deliver highly reliable signals. However, investors should only enter trades when the signals from both MACD and RSI point in the same direction.
- Avoiding reversal signals: Both RSI and MACD are highly sensitive to trend reversals. Therefore, if only one of these indicators shows a reversal signal, investors should quickly exit the position to maintain a safe risk level.
Pros and cons of using the MACD combined with RSI strategy in trading
Pros of using the MACD combined with RSI strategy
- More accurate signals: The strategy that combines RSI and MACD provides more accurate entry signals and position identification compared to using each indicator individually.
- Applicable across multiple timeframes: When combining these two indicators, investors can choose from a wider range of timeframes that better match their trading style, instead of only using higher timeframes to ensure the accuracy of RSI signals.
- Better risk control: Both RSI and MACD are highly sensitive to trend reversals. Therefore, if a reversal signal appears from either indicator, investors should quickly exit the trade to maintain safety and manage risk effectively.
Cons of using the MACD combined with RSI strategy
- Trades only when signals align: Combining RSI and MACD means investors can optimize trades only when both indicators generate the same signal. If the signals from the two indicators do not align in direction or outcome, it will be difficult to find a suitable entry point.
- False reversal signals: As mentioned earlier, when using the RSI–MACD combination, investors need to exit trades immediately when a reversal signal appears. If the reversal signal turns out to be false, traders may miss a significant profit opportunity.
- Risk factors: Although the probability of correctly predicting price trends is higher than using a single indicator, there is no guarantee that these signals will be 100% accurate. Therefore, investors must still follow strict risk management principles when trading with the MACD and RSI combination strategy.
Common mistakes when using the MACD combined with RSI strategy
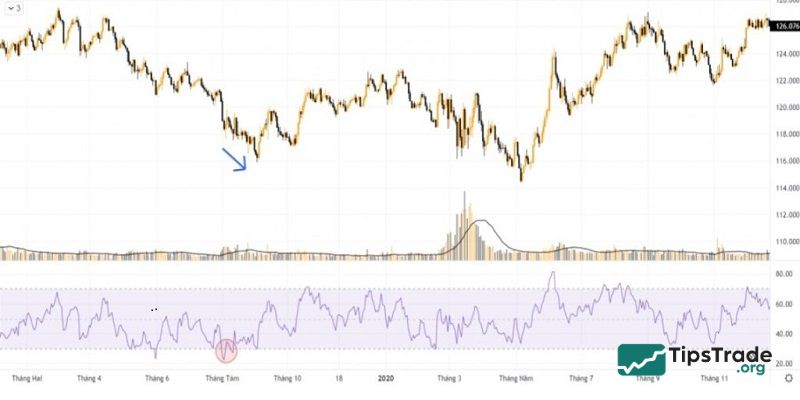
- Entering a BUY trade when the market enters an oversold condition
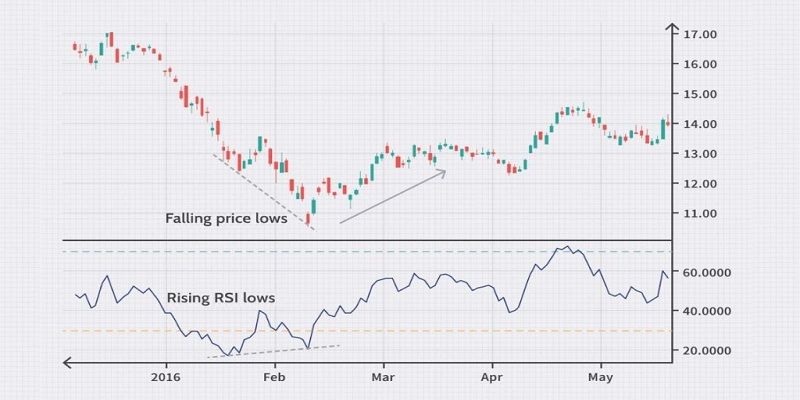
In the chart below, you can see that the RSI indicator moves into the oversold zone, which normally suggests the possibility of a strong price increase in the future. However, instead of rising, the market continues to decline and repeatedly forms new lows that are lower than the previous lows. During this time, the RSI remains in the oversold zone for an extended period.
This is a very common situation in the market. Therefore, if investors rely solely on a few simple signals, they are more likely to make this mistake. As a result, the probability of a successful trade will not be very high.
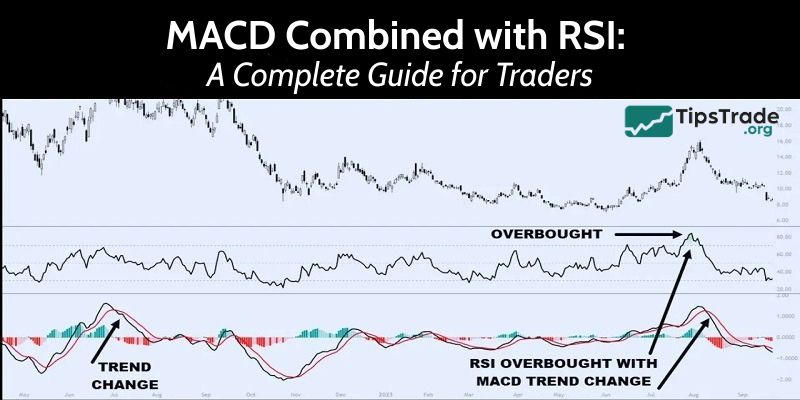
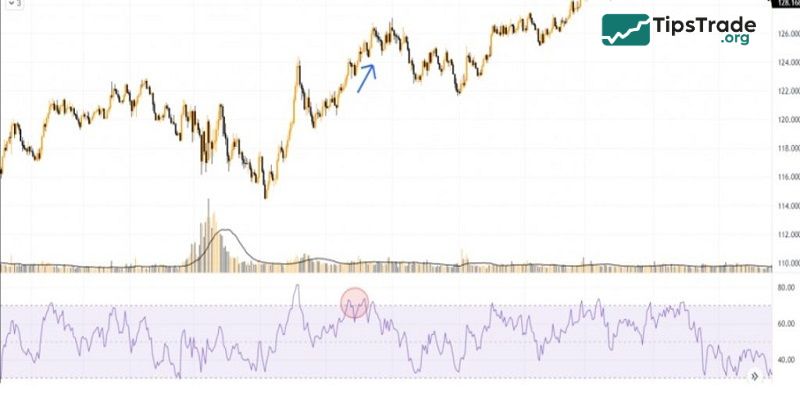
- Entering a SELL trade when the market enters an overbought condition
Similar to the previous case, we can see that the RSI overbought signal remains for quite a long time, yet the market does not reverse. Instead, the price only experiences a small corrective pullback before continuing in its original trend. Therefore, relying solely on the overbought signal from the RSI is not sufficient to improve the probability of a successful trade.
Conclusion
Above is a detailed guide to the MACD combined with RSI strategy. Similar to other combined trading strategies, using multiple indicators at the same time can provide many advantages for investors in trading. However, it also requires sufficient knowledge and experience to fully take advantage of the signals generated by these indicators.