
Inventory turnover ratio is one of the most important efficiency metrics that measures how effectively a business manages its stock. In simple terms, it tells you how many times a company sells and replaces its inventory during a specific period. A high inventory turnover ratio indicates that products are selling quickly, while a low ratio might suggest overstocking, slow sales, or inefficiencies in supply chain management. Visit tipstrade.org and check out the article below for further information.
What is Inventory Turnover and Why It Matters
Definition and Core Concept
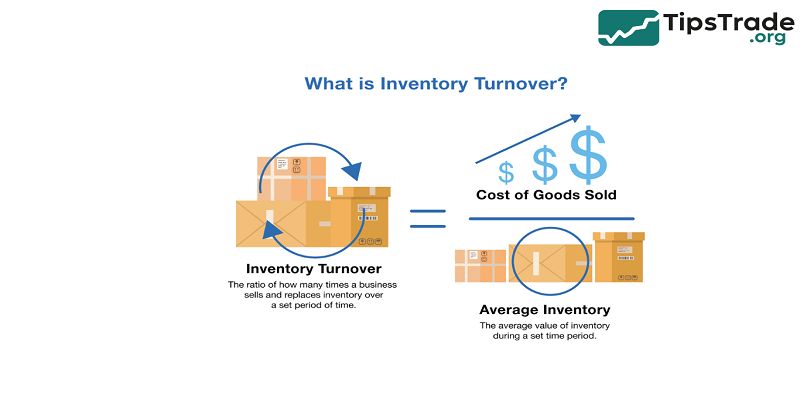
The inventory turnover ratio, also known as stock turnover or inventory turns, measures the number of times a business’s inventory is sold and replaced over a given period.
It helps answer a key question:
“How efficiently does a company convert its inventory into sales?”
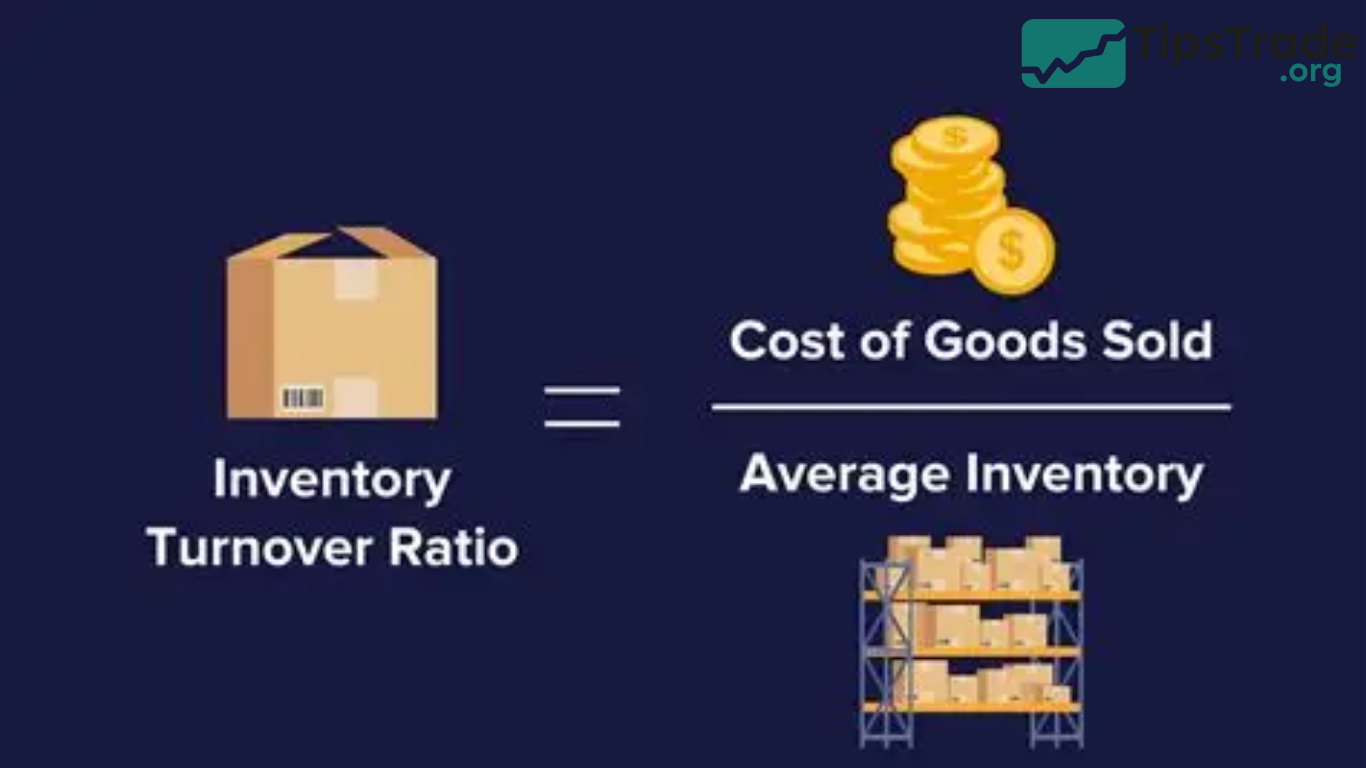
The formula is:
Inventory Turnover Ratio=Cost of Goods Sold(COGS)Average InventoryInventory\ Turnover\ Ratio = \frac{Cost\ of\ Goods\ Sold (COGS)}{Average\ Inventory}Inventory Turnover Ratio=Average InventoryCost of Goods Sold(COGS)
This ratio helps companies understand how quickly products move through their warehouse, identify slow-moving stock, and optimize purchasing or production levels.
According to Investopedia (2024), monitoring inventory turnover is essential for managing working capital and maintaining financial health.
Why Inventory Turnover Matters
A strong inventory turnover rate means that inventory management, demand forecasting, and sales execution are working together effectively.
Here’s why it matters:
- Cash flow efficiency: Faster inventory turnover reduces storage costs and frees up cash for reinvestment.
- Customer satisfaction: Maintaining fresh, in-demand stock improves order fulfillment rates.
- Investor confidence: A healthy ratio signals operational competence and good supply chain discipline.
For investors, the D/E ratio is a measure of financial risk; similarly, inventory turnover reflects operational efficiency and liquidity.
How to Calculate Inventory Turnover Ratio
Formula and Key Components
The standard formula for the inventory turnover ratio is:
Inventory Turnover=COGSAverage InventoryInventory\ Turnover = \frac{COGS}{Average\ Inventory}Inventory Turnover=Average InventoryCOGS
Where:
- COGS (Cost of Goods Sold): The total cost incurred to produce or purchase goods sold during a specific period.
- Average Inventory: Calculated as (Beginning Inventory + Ending Inventory) ÷ 2.
This formula helps eliminate seasonal variations and provides a realistic view of how fast inventory circulates.
Step-by-Step Example
Let’s illustrate with an example.
| Item | Amount (USD) |
| Cost of Goods Sold (COGS) | $300,000 |
| Beginning Inventory | $50,000 |
| Ending Inventory | $70,000 |
| Average Inventory | ($50,000 + $70,000) ÷ 2 = $60,000 |
| Inventory Turnover Ratio | $300,000 ÷ $60,000 = 5.0 |
This means the company sells and replaces its inventory five times per year.
If we convert it to Days Sales of Inventory (DSI):
DSI=3655.0=73 daysDSI = \frac{365}{5.0} = 73\ daysDSI=5.0365=73 days
So, it takes about 73 days to sell the entire stock at once.
What’s a Good Inventory Turnover Ratio?

Industry Benchmarks
There is no universal “perfect” turnover ratio; it varies by industry:
| Industry | Typical Inventory Turnover |
| Grocery / FMCG | 10–20 times per year |
| Apparel / Retail | 6–12 times per year |
| Automotive | 2–4 times per year |
| Technology / Electronics | 5–10 times per year |
| Heavy Manufacturing | 3–6 times per year |
According to CFI (Corporate Finance Institute), service industries or custom manufacturing typically have lower turnover rates due to longer production cycles.
Interpreting High vs. Low Turnover
- High Turnover (Good Sign)
→ Indicates strong sales, low storage costs, and efficient demand forecasting.
→ Example: A grocery store with perishable items should have high turnover to avoid spoilage. - Low Turnover (Warning Sign)
→ Suggests overstocking, weak demand, or outdated inventory.
→ Example: A retailer with excess slow-moving stock might tie up working capital unnecessarily.
However, too high a turnover could mean understocking — leading to lost sales due to stockouts. Balance is key.
Real-World Application & Implications
Using Inventory Turnover in Business Decisions
Inventory turnover directly influences pricing, purchasing, and supply chain strategies.
For instance:
- If turnover is declining, it may be time to reduce purchase orders, run promotions, or reassess demand forecasts.
- If turnover is too high, consider expanding inventory or diversifying suppliers to prevent shortages.
Successful companies like Walmart and Amazon use real-time data analytics to track turnover across categories, maintaining lean but responsive inventory systems.
Limitations and Pitfalls
Despite its usefulness, the inventory turnover ratio has some caveats:
- Industry differences: Comparing across industries can be misleading.
- Accounting variations: FIFO, LIFO, or weighted-average methods affect COGS and inventory valuation.
- Seasonality: Retailers experience high turnover during holidays and low during off-peak seasons.
- Asset valuation: High turnover doesn’t always mean profitability — it must align with margins and sales growth.
That’s why analysts combine inventory turnover with metrics like gross margin, asset turnover, and working capital ratio for deeper insight.
How to Improve Inventory Turnover Ratio

Operational Strategies
- Improve demand forecasting: Use AI-based or data-driven prediction tools to match supply with demand.
- Adopt just-in-time (JIT) inventory: Reduces holding costs and minimizes waste.
- Optimize product mix: Focus on fast-moving SKUs, remove obsolete items.
- Enhance sales and promotions: Use targeted campaigns to move slow inventory.
- Streamline supplier relationships: Shorter lead times help maintain ideal stock levels.
Financial and Strategic Measures
- Adjust pricing strategies: Dynamic pricing can help balance stock levels.
- Use consignment or vendor-managed inventory (VMI): Shifts some inventory costs to suppliers.
- Improve cash flow management: Reinvest capital saved from faster turnover.
- Adopt technology: Inventory management software like SAP, Oracle, or TradeGecko helps automate analysis.
Inventory Turnover vs. Related Efficiency Ratios
Days Sales of Inventory (DSI)
The Days Sales of Inventory (DSI) metric complements turnover by showing how many days it takes to sell current inventory.
Formula:
DSI=365Inventory TurnoverDSI = \frac{365}{Inventory\ Turnover}DSI=Inventory Turnover365
Lower DSI = faster sales.
Example: A DSI of 50 days means the company clears its stock roughly every 50 days.
Comparison with Other Efficiency Ratios
| Ratio | Formula | Focus | Purpose |
| Inventory Turnover | COGS ÷ Average Inventory | Stock movement | Efficiency of sales & inventory |
| Asset Turnover | Revenue ÷ Total Assets | Use of total assets | Overall business efficiency |
| Working Capital Turnover | Revenue ÷ Working Capital | Short-term liquidity | Ability to generate sales from working capital |
Each ratio tells part of the efficiency story. Together, they give a holistic view of financial health.
Conclusion
Inventory Turnover ratio is a crucial metric that reflects how efficiently a company manages its inventory. This ratio helps businesses understand the speed at which inventory is sold and replaced over a period, indicating operational efficiency and demand forecasting accuracy. Monitoring the Inventory Turnover ratio allows companies to reduce holding costs, avoid stock outs, and improve overall profitability.