
Indicators in MT4 are indispensable tools that help financial investors analyze the market and make more accurate trading decisions. With a variety of indicators, you can optimize your trading strategy. In this article, we provide you the top 6 indicators in MT4 that are widely used. From there can help you improve your trading efficiency. Let’s explore these amazing tools right now!
What are MT4 indicators?
MetaTrader 4 has indicators that are mathematical tools. They are used to analyze past price data and present that data visually to the trader. Indicators are a crucial part of technical analysis because they provide key insights into market trends, price action, momentum, volatility, and potential reversal points.
MetaTrader 4 alone offers 30 built-in indicators, over 2,000 free custom indicators, and 700 paid indicators. These tools allow traders to perform even the most complex market analyses to make trading decisions.
Classifying MT4 indicators
With the development of science and technology, there are now hundreds of thousands of indicators being researched and developed by different traders. Each type has its own usage and function. However, based on the signals provided, we can divide indicators into two main types: Leading Indicators and Lagging Indicators.
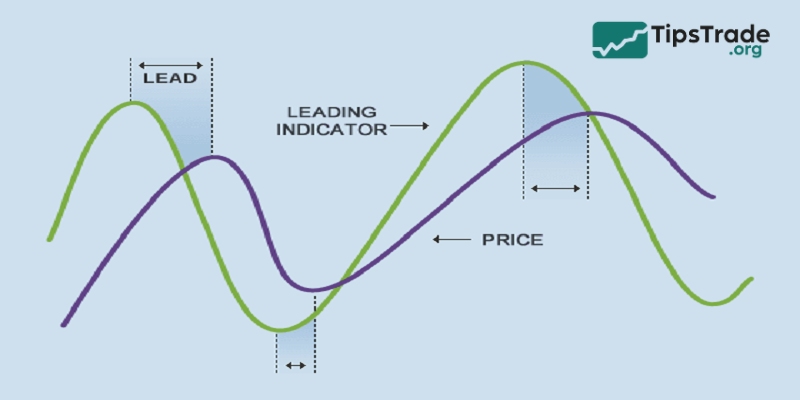
Leading indicators
The leading indicators provide an earlier signal of price changes. They tend to react quickly and provide potential buy/sell signals before the main price trend officially changes. However, due to their rapid nature, they can lead to false signals and need to be confirmed by other indicators or further analysis.
Advantages of leading Indicators MT4:
- Early signals help investors avoid missing opportunities.
- Bringing significant profits to investors who know how to capitalize on trends.
Disadvantages of leading indicators for MT4:
- Often generates many false signals, posing a risk to less experienced traders.
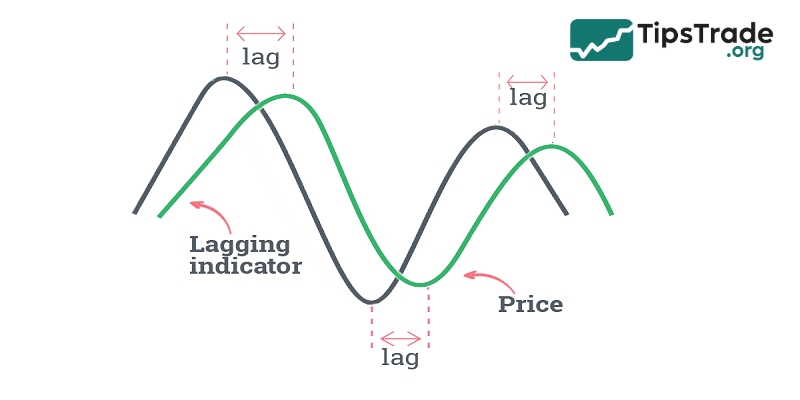
Lagging indicators
Lagging indicators react more slowly to price changes and are often used to CONFIRM current trends.
They are based on historical data and are used to identify entry or exit points for orders after a trend has been established. The slow indicator helps minimize false signals and provides an overview of the market situation.
Advantages of lagging indicators MT4:
- Generates a good signal with higher accuracy compared to a fast indicator.
Disadvantages of lagging indicators in MT4:
- The signal is delayed, so investors are late to the trend, resulting in lower profits.
Top 6 popular and effective indicators in MT4
Below are the top 6 popular and effective indicators in MT4, each offering unique insights for traders:
Moving averages
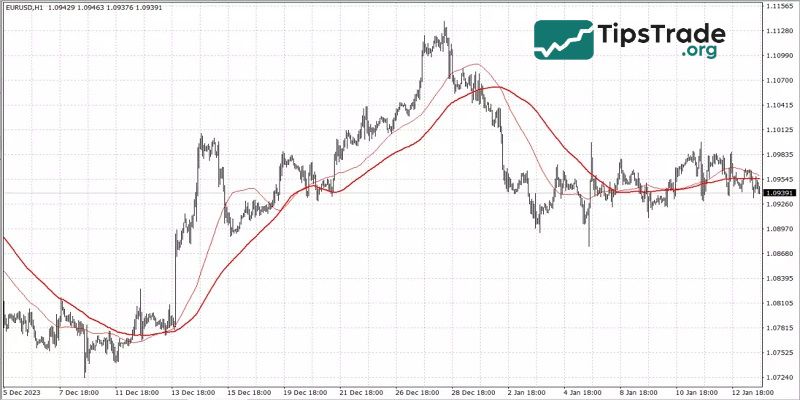
Moving Averages (MA) are a prominent and one of the most popular indicators used on the MetaTrader 4 (MT4) platform, revered for their simplicity and effectiveness. These indicators smooth price data over a specific period, creating a single line that makes it easier to identify trends.
Key Features:
- Types: The most common types are the Simple Moving Average (SMA) and the Exponential Moving Average (EMA). SMA calculates the average price over a specific period, while EMA places more emphasis on recent prices.
- Timeframe: MA can be applied to various timeframes, from a few minutes to several months, suiting different trading styles.
How to use:
- Identify trends: A rising MA line indicates an uptrend, while a falling MA line indicates a downtrend.
- Support and Resistance: MA can act as dynamic support and resistance levels.
- Crossovers: A common strategy involves observing the crossovers of short-term and long-term moving averages. For example, when the short-term MA crosses above the long-term MA, it can signal a buying opportunity.
Moving averages are very flexible, easy to use, and can be extremely effective when working with trends, but they are unlikely to be sufficient as a tool for making trading decisions.
Parabolic SAR
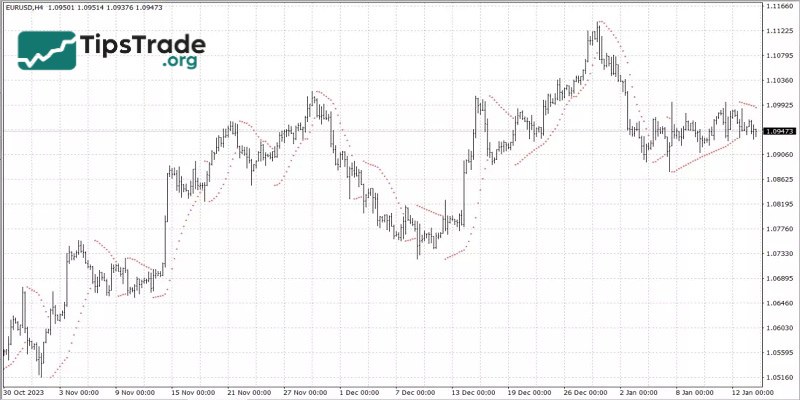
The Parabolic SAR (Stop and Reverse) is a unique and versatile indicator in the MetaTrader 4 toolkit, widely used for its ability to identify potential trend reversals. This indicator is visually represented as dots located above or below the price on the chart.
Key Features:
- Trend direction: When the dots are below the price, this indicates an upward trend, and when they are above the price, this indicates a downward trend.
- Acceleration factor: SAR starts slowly and accelerates with the trend, reflecting market momentum.
Strategy:
- Entry and exit points: Traders often use the Parabolic SAR to identify optimal entry and exit points. For example, enter a trade when the dots flip below the price in an uptrend and exit the trade when they flip above.
- Stop-loss order: Also used for trailing stop-loss orders, providing a flexible exit point that adjusts with price fluctuations.
The Parabolic SAR excels in trending markets but can generate false signals in oscillating conditions. Therefore, it is often paired with other indicators to increase accuracy. To use the parabolic SAR effectively, it’s important to choose the right time period and acceleration factor and use them in conjunction with other indicators.
ADX
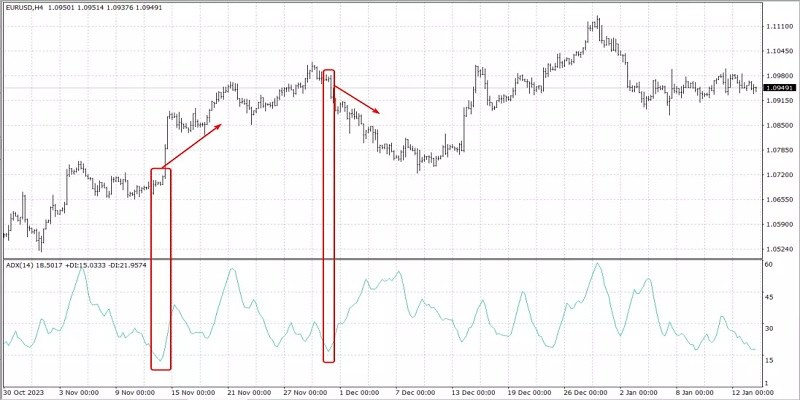
The Average Directional Index (ADX) is a key tool in MT4 for assessing trend strength. It doesn’t indicate the direction of the trend, but rather measures its strength or weakness.
Key Features:
- Range: The ADX oscillates between 0 and 100, with higher values indicating a stronger trend.
- Components: Includes the Positive Directional Indicator (+DI) and the Negative Directional Indicator (-DI) to help determine trend direction.
Strategy:
- Strength of the trend: An ADX value above 25 indicates a strong trend, while below 20 indicates a weak trend.
- Crossover: When the +DI crosses above the -DI, it can signal an uptrend, and vice versa for a downtrend.
ADX is best used in conjunction with other indicators because it does not provide complete information. It’s ideal for traders looking to strengthen their trend-based strategies.
Volume
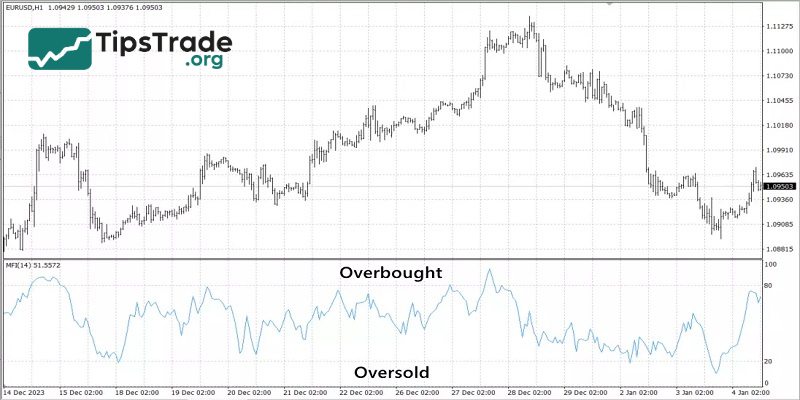
Volume, one of the most basic indicators in MT4, measures the number of shares or contracts traded for a security or the entire market over a specific period. Along with the usual tick volume, MT4 has the ability to use volume indicators such as the Money Flow Index (MFI), On Balance Volume (OBV), and others.
Key Features:
- Market activity: High volume indicates strong market interest, while low volume suggests less market interest.
- Confirmation: Volume can confirm trends or chart patterns. Increasing volume alongside the price trend reinforces the validity of the trend.
Strategy:
- Confirming the trend: Trends accompanied by increasing volume are considered strong, while those with decreasing volume may signal weakness.
- Mass oscillator: Tools like On-Balance Volume (OBV) and Money Flow Index (MFI) help analyze volume changes, providing insights into potential price movements.
Volume indicators are very important in validating price movements and are often used in conjunction with other technical indicators to strengthen trading strategies. They are particularly useful in detecting reversals and the continuation of trends.
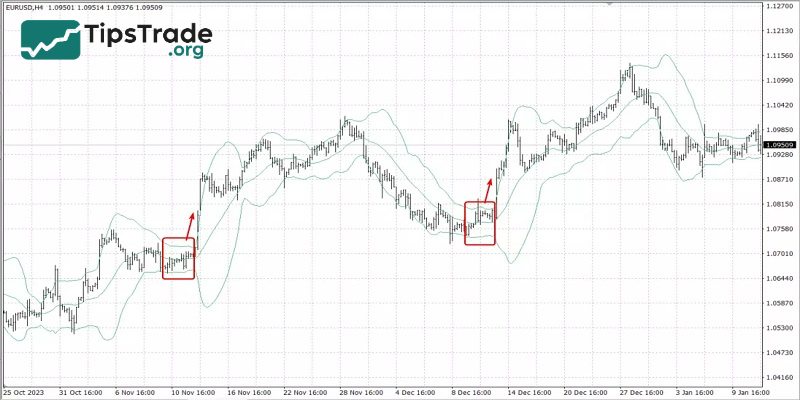
Bollinger bands
Bollinger Bands is a highly regarded technical analysis tool in MetaTrader 4, known for its ability to measure market volatility. Developed by John Bollinger, these bands consist of three lines: a moving average in the middle, with two outer bands that adjust dynamically to volatility.
Key Features:
- Volatility indicator: The bands expand during periods of high volatility and contract during periods of low volatility, providing a visual signal of market conditions.
- Overbought and oversold levels: When the price touches the upper band, it could signal an overbought condition, while touching the lower band could indicate an oversold condition.
Strategy:
- Reverse the trend: Traders often view the price of the bands as an indicator of potential trend reversals.
- Squeeze: “Bollinger Squeeze,” when the bands converge, can signal an upcoming strong price movement.
- Combined with MA: Combining Bollinger Bands with a moving average can enhance trend identification and entry/exit decision-making.
Bollinger Bands are best used in both trending and volatile markets, but should be used in conjunction with other indicators for optimal results.
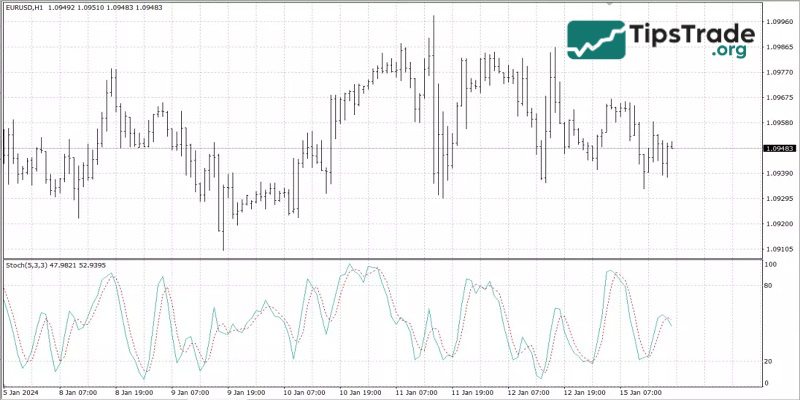
Stochastic
The Stochastic Oscillator, a momentum indicator in MT4, compares a specific asset’s closing price to its price range over a specific period. This indicator is similar to the Relative Strength Index (RSI) but has distinct features.
Key Features:
- Range: Values range from 0 to 100, with overbought conditions indicated above 80 and oversold conditions below 20.
- Lines K and D: Consisting of two lines, %K (the main line) and %D (the signal line), which provide trading signals through crossovers and divergences.
Strategy:
- Overbought/oversold conditions: Traders use the 80 and 20 levels as signals for potential reversals. A reading above 80 indicates an overbought market, while below 20 suggests an oversold market.
- Crossover: A common strategy involves acting on the crossover between the %K and %D lines. For example, a bullish signal is generated when the %K line crosses above the %D line, and vice versa for a bearish signal.
- Divergence: Divergence between the Stochastic Oscillator and price action is another important signal. Price reaching a new high while oscillators fail to do so could be a sign of weakening momentum.
Although the Stochastic Oscillator provides valuable insights, especially in sideways markets, it is most effective when combined with other indicators, such as the RSI, to confirm signals and avoid false positives.
Benefits of using indicators in MT4
Indicators in MT4 offer numerous advantages to traders, enhancing their analysis and decision-making processes. Here are some key benefits:
- Advanced market analysis: Indicators in MT4 provide deeper insights into market trends, volume, and momentum. This comprehensive analysis helps traders identify potential trading opportunities and make informed decisions.
- Customizable and flexible: With numerous indicators available, MT4 allows users to customize and adjust their analysis according to their specific trading style and strategy. Whether it’s a trend, momentum, volume, or volatility indicator, traders can choose the one that best suits their needs.
- Risk management: Many indicators, especially those related to volatility and momentum, support effective risk management. They help set appropriate stop-loss and take-profit levels, ensuring traders minimize losses and lock in profits.
- Signal confirmation: Indicators are excellent tools for confirming trading signals obtained from other analyses, such as chart patterns or fundamental analysis. This confirmation helps reduce the likelihood of false signals and improves the accuracy of trading decisions.
- Accessibility: The user-friendly interface of MT4 makes these indicators easily accessible and usable for traders of all levels, making complex trading decisions more approachable for a wider audience.
- Real-time data analysis: Indicators in MT4 provide real-time market analysis, allowing traders to react quickly to market changes and adjust their strategies accordingly.
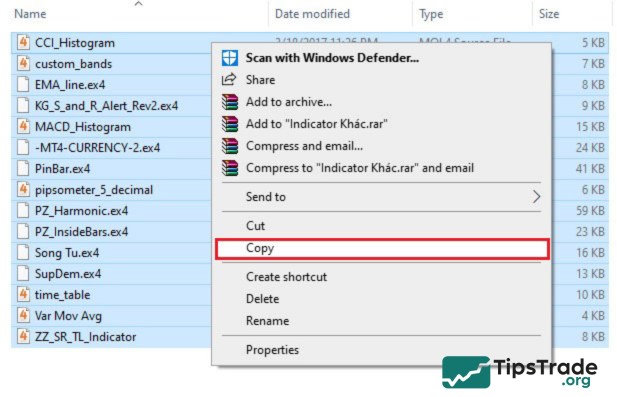
Instructions for installing indicators in MT4
To install indicators in MT4, you can follow these steps:
- Step 1: Go to the folder containing Indicators, right-click on the Indicator you want to install, and select Copy.
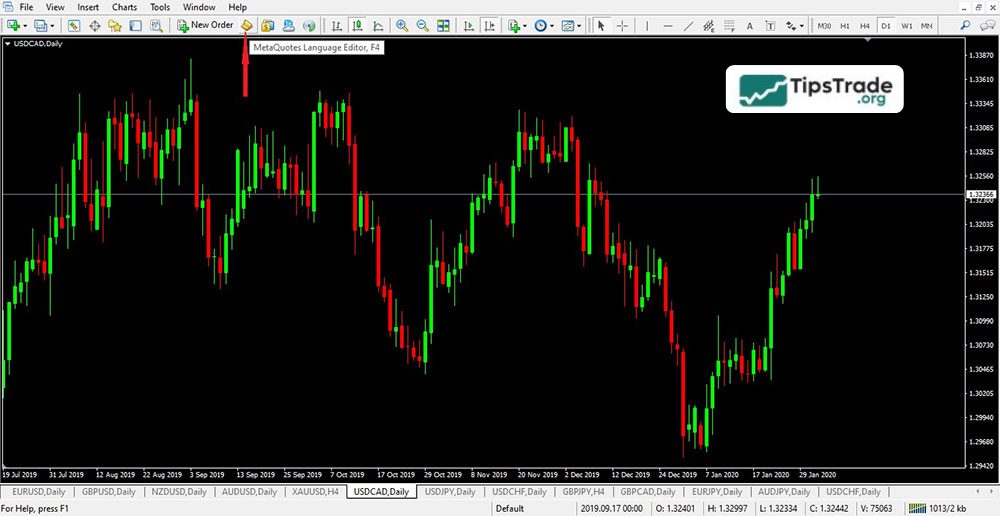
- Step 2: Open the MT4 software, click the MetaQuotes Language Editor icon to open the MetaEditor interface.
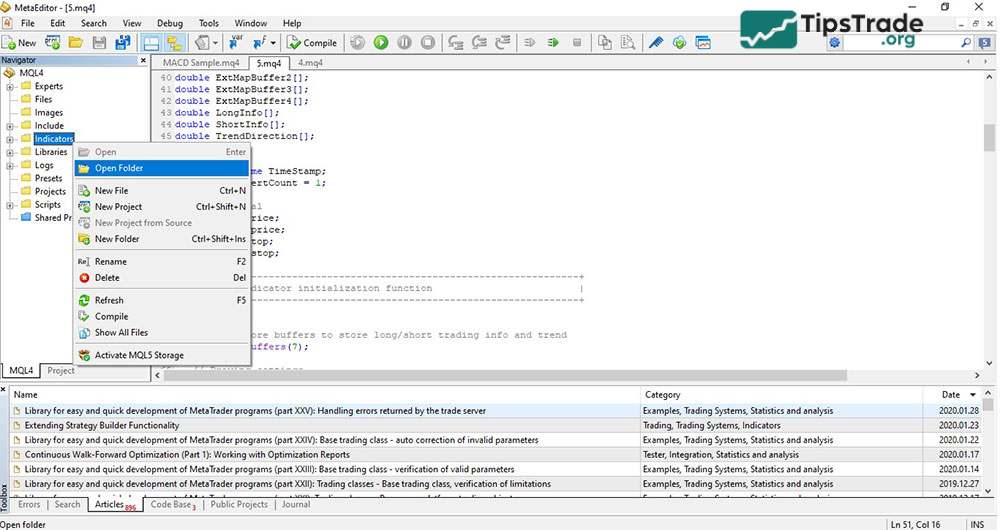
- Step 3: In the Navigator window, right-click on Indicators and select Open Folder.
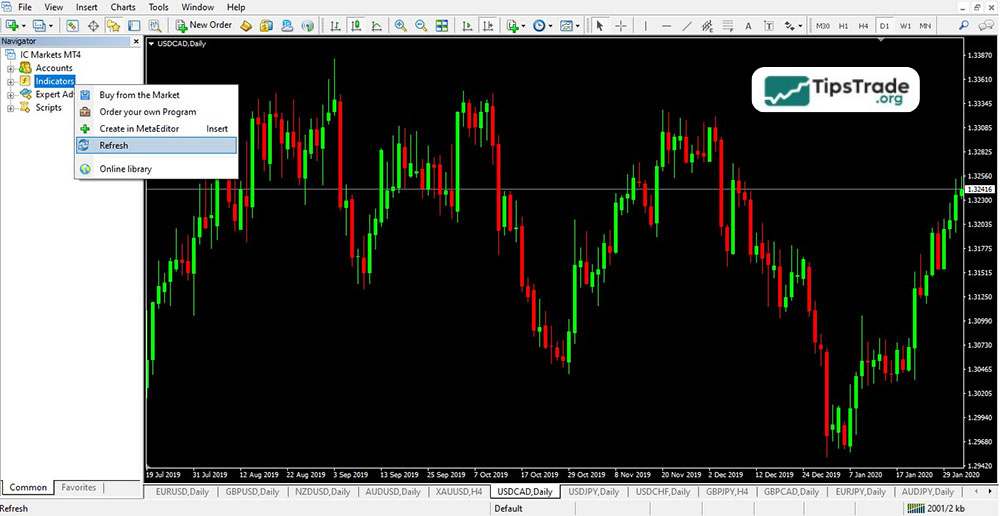
- Step 4: Go back to the MT4 software, in the Navigator window, right-click on Indicators, select Refresh to load the Indicators into MT4.
Some frequently asked questions about indicators in MT4
Below are some frequently asked questions (FAQs) about indicators in MT4:
What are indicators in MT4 used for?
Indicators in MT4 help traders analyse price action by showing momentum, trends, volatility, or potential reversals. Indicators simplify decision-making on the MT4 platform.
Can I use multiple indicators at the same time in MT4?
Yes, MT4 allows you to use multiple indicators on a single chart. Many traders combine various indicators (e.g., Moving Averages with RSI or MACD) to get more accurate signals.
What’s the difference between built-in and custom indicators in MT4?\
MT4 comes with built-in indicators like RSI, MACD, and Moving Averages. Custom indicators are user-created add-ons that provide more specialised functions.
Which indicators in MT4 are best for beginners?
RSI and Moving Averages are often recommended as starting points because they’re simple, widely used, and provide clear signals.
Final thoughts
All indicators among the Top 6 indicators in MT4 that are widely used offer traders opportunities to elevate their money-making strategies. These indicators are all easily integrated into trading platforms and are completely free to download. However, to fully utilize these indicators, investors need to use them correctly according to the instructions and advice. We wish you all the best of luck and success in your investments! Thank you for taking the time to read this article.