
Are you wondering what the Ichimoku indicator is and why it’s used by many traders around the world? Ichimoku Kinko Hyo is one of the powerful technical analysis tools that helps investors visually identify trends, support and resistance zones, and trading signals. This article will explain in detail what Ichimoku is, its components, and how to apply it effectively in trading.
What is Ichimoku indicator?
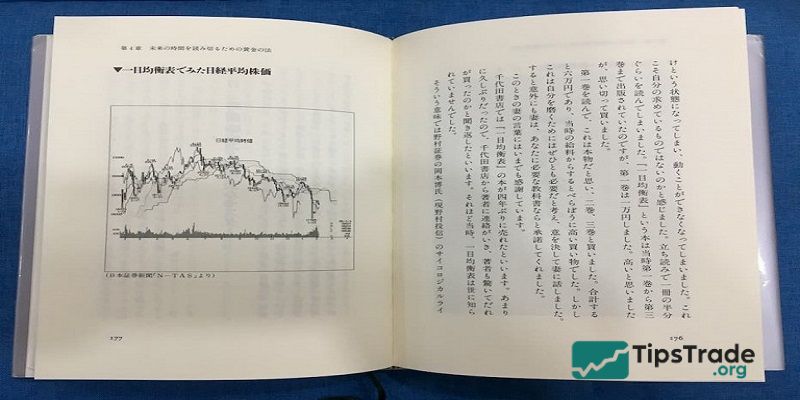
The Ichimoku indicator, also known as Ichimoku Kinko Hyo, is a comprehensive technical indicator widely used in financial markets. It was developed by Goichi Hosoda, a Japanese journalist, in the late 1930s and published in 1969.
Ichimoku is not just an indicator, it is a complex technical analysis system that combines many factors to give investors a comprehensive view of the market. Ichimoku helps to identify trends, support and resistance levels, momentum and gives trading signals.
>>See more:
- Understanding RSI indicator: A Beginner’s Guide
- What is the MACD Indicator and How to Use It?
- Moving Averages and how does it use to find the trend
- Bollinger Bands – An effective technical indicator for investment trading!
Components of the Ichimoku indicator
The Ichimoku indicator is composed of five indicator lines with different roles and meanings. Below are the details of the concept, calculation, and application of these indicator lines.
Base Line (Kijun-sen)
The Kijun-Sen (Base Line) is the most important line in the Ichimoku cloud indicator, calculated based on data from the last 26 consecutive trading sessions. The calculation of Kijun-Sen is as follows:
(Highest high of 26 periods + Lowest low of 26 periods) / 2
The Kijun-Sen line is usually horizontal, and prices will follow this line because it is a long-term average. Therefore, investors can predict the price movement trend based on the Kijun-Sen line as follows:
- If the price is above the Kijun-Sen line, the price trend is up.
- If the price is below the Kijun-Sen line, the price trend is down.
- The steeper the Kijun-Sen line, the more volatile the price.
- Kijun-Sen line is horizontal, the market is in Sideway period.
However, because the Kijun-Sen line uses historical price data, there will be a certain lag. Therefore, this line is often used to determine support and resistance levels, not to determine trading points.
Conversion Line (Tenkan-sen)
Tenkan-sen is a line that shows the average price over the last 9 sessions. The calculation is as follows:
Tenkan-Sen = (9-Period Highest High + 9-Period Lowest Low) / 2
Due to its shorter cycle, the Tenkan-Sen line reacts to prices more quickly, helping investors identify more accurate buying and selling points. In practice, investors often use a combination of the Kijun-Sen line and the Tenkan-Sen line to identify potential trading points. In which:
- Kijun-Sen line crosses Tenkan-Sen line from bottom up is a buy signal.
- Kijun-Sen line cuts Tenkan-Sen line from top to bottom is a sell signal.
When the Kijun-Sen line crosses the Tenkan-Sen line from above, it’s a sell signal.
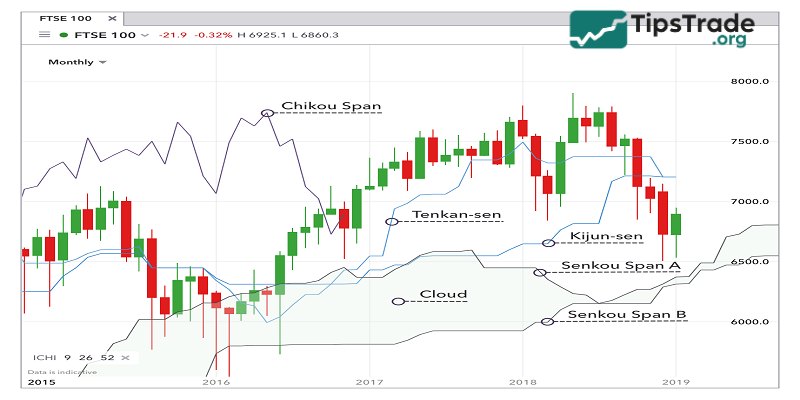
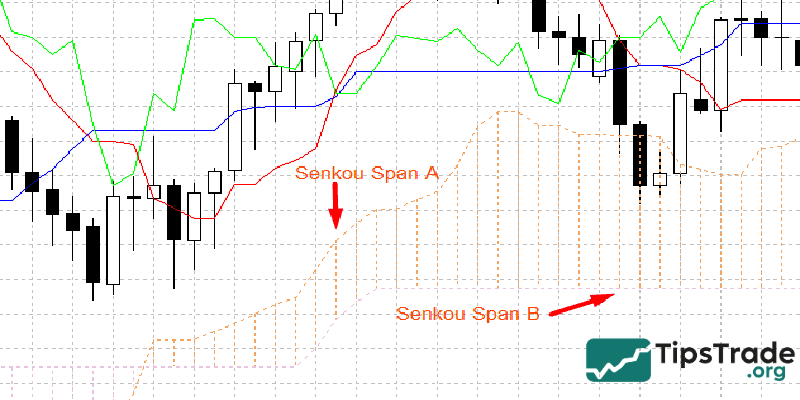
Leading Span A (Senkou Span A)
Senkou Span A or Leading Span A, leading line A, Senkou Span A, leading span A is the average of Kijun-Sen line and Tenkan-Sen line, going back 26 most recent trading sessions. The calculation is as follows:
Senkou-Span A = (Kijun-Sen + Tenkan-Sen)/2
The Senkou-Span A line forms one edge of the Kumo cloud. This line is often used to identify future support and resistance zones.
Leading Span B (Senkou Span B)
Senkou-span B is shown 26 periods ahead, similar to Senkou-span A. Senkou-span B takes the highest and lowest prices averaged over 52 trading sessions. Senkou-span B is combined with Senkou-span A to form support and resistance lines, also known as clouds. The calculation formula is as follows:
Senkou Span B = (52-Period High+ 52-Period Low) / 2
Lagging Span (Chikou Span)
The Chikou Span is a line determined by the current trading session’s closing price, shifted back 26 periods. The Chikou-Span line helps investors identify resistance zones, support zones, and price trends. Specifically, as follows:
- The Chikou-Span line is above the price line, and the price tends to rise.
- The Chikou-Span line is below the price line, and the price tends to decrease.
- The Chikou-Span line closely follows the price line, and the market is sideways.
- The further the Chikou-Span line is from the price line, the stronger the current price trend, and vice versa.
How to apply the Ichimoku indicator in technical analysis
To trade effectively with the Ichimoku indicator, investors need to know how to use it. Here’s a guide on how to use and interpret the Ichimoku indicator in 5 specific cases.
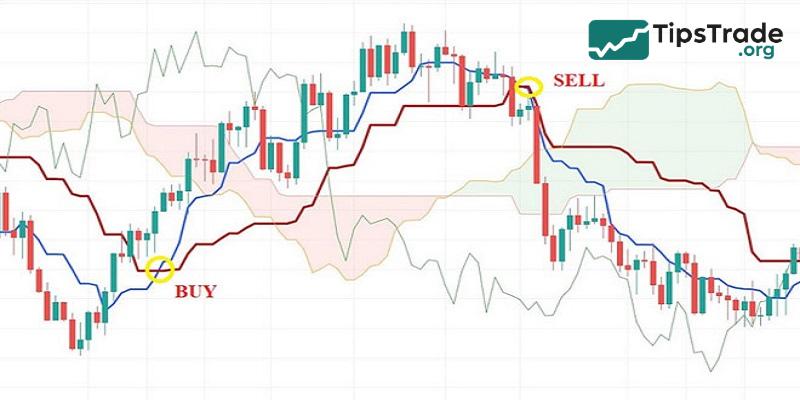
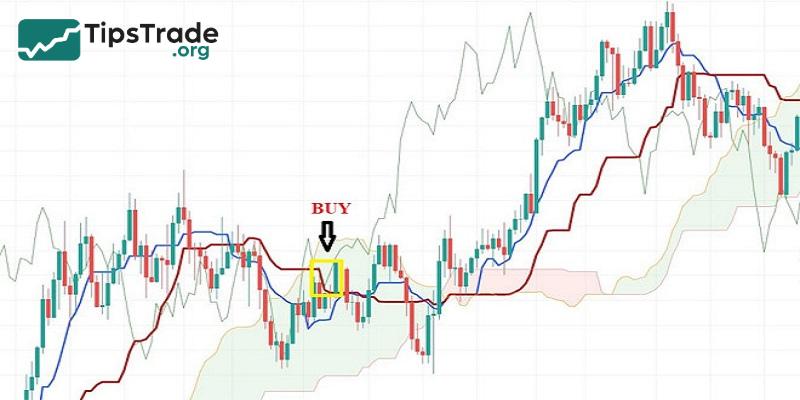
Tenkan-Sen crosses Kijun-Sen
Based on the intersection of the Kijun-Sen line and the Tenkan-Sen line, investors can determine when to place a buy/sell order, specifically:
- When the Tenkan-Sen line cuts the Kijun-Sen line from bottom to top at the intersection point below the Kumo cloud, it is a sell signal.
- When the Tenkan-Sen line cuts the Kijun-Sen line from top to bottom at the intersection point above the Kumo cloud, it is a buy signal.
Chikou-Span cross price line
When the Chikou-Span line crosses the price line, it is also a potential order signal:
- When the Chikou-Span line cuts the price line from top to bottom, and at the same time the Chikou-Span line moves away from the price line, it is a sell signal.
- When the Chikou-Span line cuts the price line from bottom up, then the Chikou-Span line also moves away from the price line, it is a buy signal.
How to enter an order:
- Entry point: Determined by the signal candle near the intersection area. If looking for a buy order, it is a green candle, if looking for a sell order, it is a red candle.
- Stop loss: Located below the crossover zone, near the support level if looking for a buy order or located above the crossover zone, near the resistance level if looking for a sell order.
- Take-profit point: Calculated according to the R:R ratio (risk/reward ratio) according to the investor’s expectations.
Senkou-Span A cuts Senkou-Span B
The signal of the two lines Senkou-Span A and Senkou-Span B intersecting each other indicates the time to execute a buy/sell order:
- When line A cuts line B from bottom up, the Kumo cloud changes color from red to green, signaling an uptrend, a signal to place a buy order.
- When line A cuts line B from top to bottom, the Kumo cloud changes color from green to red, signaling a downtrend, a signal to place a sell order.
Price breakout from Kumo cloud
Breakout trading is risky but will bring big profits when successful. This strategy is suitable for long-term, experienced investors, new investors should not do it.
With this method, when you see the price breakout from the Kumo cloud, you can place an order immediately. If not, place an order while waiting for the price to reset the breakout zone.
- If the current downtrend shows signs of slowing down, the price breaks the Kumo cloud from below, and the price closes above the Kumo cloud. This is a buy signal.
- If the current uptrend is showing signs of weakening, the price breaks the Kumo cloud from above, and the price closes below the Kumo cloud. This is a signal to place a sell order.
How to enter an order:
- Entry point: Right at the signal candle after the breakout.
- Stop loss: For buy orders, the stop loss is below the intersection of lines A and B. For sell orders, the stop loss is above the intersection of lines A and B.
- Take-profit point: Determined according to the investor’s expected R:R (Risk/Profit) ratio.
Limitations of the Ichimoku indicator
In reality, investors don’t use only one Ichimoku indicator to analyze the market; they combine it with several other indicators. The reason is that this indicator still has the following limitations:
- Ichimoku uses past data as leading and lagging lines. The probability of past data repeating itself is not as high as that of an indicator.
- Like other technical indicators, this indicator can also give incorrect signals about price candles. Leading to losing decisions for investors.
- When using low time frames such as 1 hour, 4 hours,… the ichimoku cloud gives signals that are not comprehensive and overall of the chart system.
Conclusion
Thus, through this article, we hope that we have helped you understand what the Ichimoku indicator is, its basic components, and how to use it to analyze market trends. This is a versatile tool that not only helps identify entry points but also supports effective risk management. However, to trade successfully with the Ichimoku indicator, you need to practice and combine it with other indicators to increase accuracy. Start testing the Ichimoku indicator today to enhance your technical analysis skills!
See more: