
The Ichimoku Cloud is a powerful trading tool in the financial markets. This indicator can function as an almost complete, standalone trading system. However, many beginner traders still feel confused when interpreting its signals, which can lead to misunderstandings of Ichimoku signals. In the article below, Tipstrade.org explains what the Ichimoku cloud is. Beside that, we also suggest the Top 5 effective Ichimoku cloud trading strategies for beginners. Check it out now!
What is the Ichimoku cloud?
Ichimoku cloud is a technical analysis system developed by Japanese journalist Goichi Hosoda in the late 1930s. Its name means “Equilibrium chart at a glance.” True to its name, this indicator allows traders to identify trends, measure momentum, and determine potential support and resistance levels with just a single look. It is considered an “all-in-one” tool because it integrates multiple time frames and data into a single chart, eliminating the need for many additional indicators.
- How to Use the Momentum Indicator when Trading
- What is a Stochastic Oscillator? A comprehensive guide
- Top 5 Best Types of Volume Oscillators (VO) Trader Should Know
- Bollinger Bands – An effective technical indicator for investment trading!
Unlike individual indicators that focus on only one aspect of the market, Ichimoku cloud provides a comprehensive overview. It not only indicates the current trend but also outlines potential price zones that may occur in the future. This helps traders make more informed trading decisions. The system consists of five separate lines, each serving a specific role, and together they form a complete picture of price action. The uniqueness of Ichimoku lies in the “Kumo,” or “cloud,” a shaded area on the chart that represents dynamic support and resistance levels.
Thanks to its ability to present a large amount of information in a visual format, Ichimoku cloud has become extremely popular among traders worldwide. It is suitable for various markets, including stocks, forex, and cryptocurrencies. This system helps traders answer three core questions:
- Is the market trending?
- Is the trend strong or weak?
- Where are the potential entry and exit points?
Understanding the 5 key components of the Ichimoku cloud
To master the Ichimoku cloud, the first step is to clearly understand the role and significance of each of its components. The system consists of five main lines, each calculated using past price data, which work together to generate trading signals. Grasping the “anatomy” of the indicator is essential for accurately reading it and applying strategies. Here’s a detailed look at the five core components:
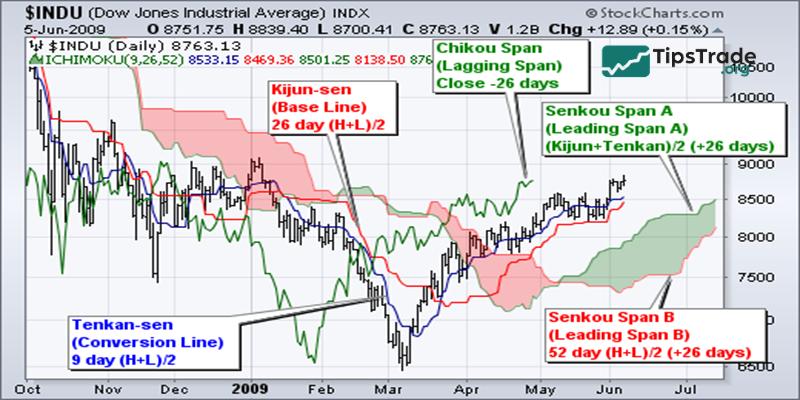
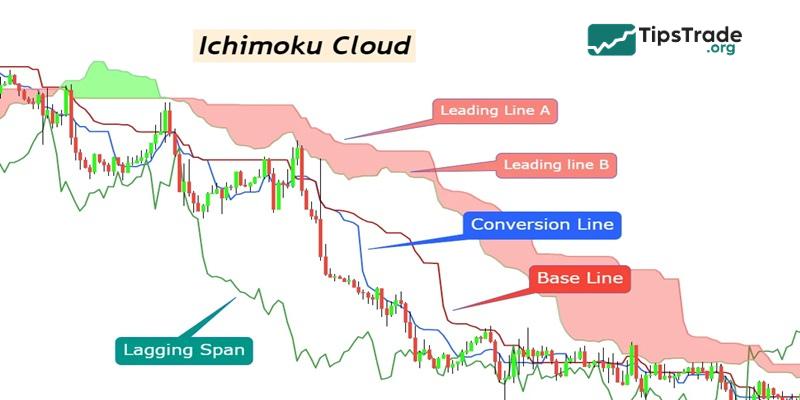
- Tenkan-sen (Conversion Line): This is the most sensitive line to price and reflects short-term momentum. It is calculated as the average of the highest and lowest prices over the past 9 periods. Tenkan-sen is often likened to a fast-moving moving average. When this line slopes upward, it indicates increasing buying momentum, and vice versa. It is commonly used to identify early trading signals.
- Kijun-sen (Base Line): This line represents the market’s medium-term trend. It is calculated as the average of the highest and lowest prices over the past 26 periods. Because it is based on a longer time frame, Kijun-sen moves more slowly than Tenkan-sen. It serves as an important dynamic support or resistance level and acts as an indicator of price equilibrium.
- Senkou Span A (Leading Span A): This is one of the two lines that form the Kumo (cloud) and is projected 26 periods into the future. It is calculated as the average of Tenkan-sen and Kijun-sen. Senkou Span A represents the faster boundary of the cloud and serves as an indicator of future support and resistance zones.
- Senkou Span B (Leading Span B): This is the other line that forms the cloud and is also projected 26 periods forward. It is calculated as the average of the highest and lowest prices over the past 52 periods. Because it is based on the longest time frame, Senkou Span B moves the slowest and creates a stronger boundary for the cloud. It represents the market’s long-term equilibrium.
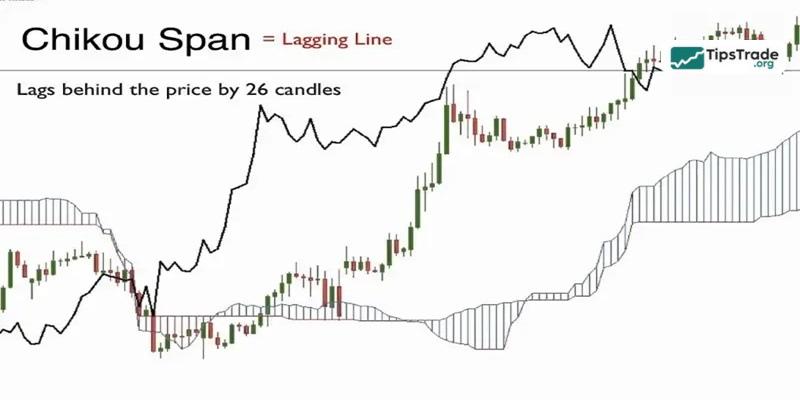
- Chikou Span (Lagging Line): This is the most unique component of Ichimoku, calculated by taking the current closing price and shifting it 26 periods into the past. Chikou Span helps confirm trends and the strength of signals. When this line is above past price levels, it confirms an uptrend; conversely, when it is below past price levels, it confirms a downtrend.
How to read charts and accurately identify trends using the Kumo cloud
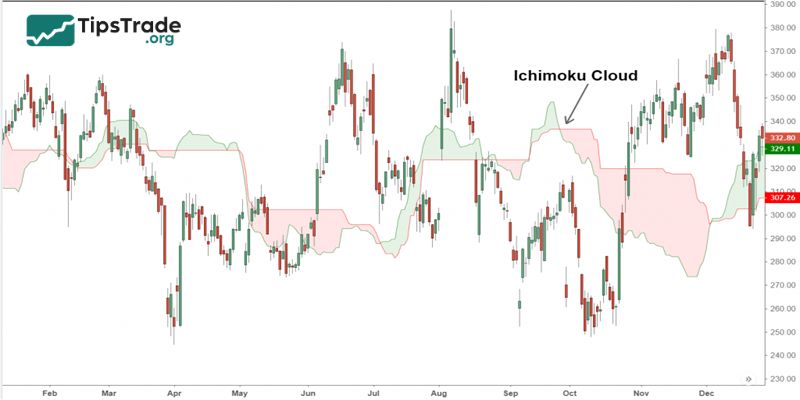
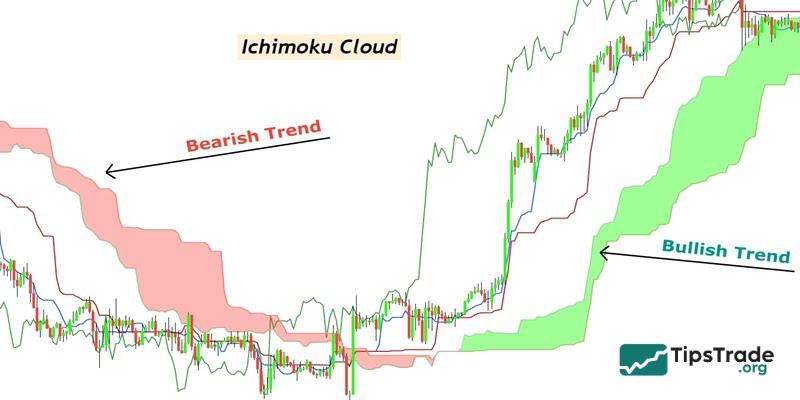
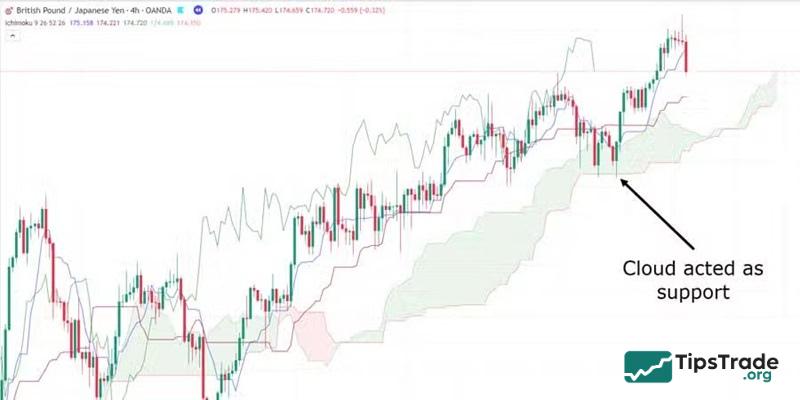
The most visual and powerful component of the Ichimoku system is the Kumo cloud. The Kumo is formed by the space between Senkou Span A and Senkou Span B. It is not just an indicator but also a visual map of market sentiment, showing dynamic support and resistance zones as well as volatility levels. Accurately interpreting signals from the Kumo cloud is key to identifying the market’s primary trend.
The position of price relative to the cloud is the first and most important signal for trend determination. A trend is considered strong and clear when the price moves entirely above or below the cloud. Conversely, when the price is inside the cloud, it indicates a sideways or uncertain market, which is usually not an ideal time to trade. Additionally, the cloud’s color and thickness provide valuable information. A thick cloud indicates strong support/resistance and high historical volatility, while a thin cloud suggests the opposite.
Here are the basic rules for reading charts and identifying trends using the Kumo cloud:
- Uptrend: When the price is above the Kumo cloud, it indicates that buyers are in control. The cloud acts as a strong support zone.
- Downtrend: When the price is below the Kumo cloud, it indicates that sellers are dominant. The cloud serves as a strong resistance zone.
- Sideways/Range-bound Market: When the price moves inside the Kumo cloud, it signals indecision and no clear trend. Traders typically avoid trading during this phase.
- Cloud Color: When Senkou Span A is above Senkou Span B, the cloud is usually green, signaling a potential future uptrend. Conversely, when Senkou Span A is below Senkou Span B, the cloud is red, indicating a potential downtrend.
- Kumo Twist: This occurs when Senkou Span A and Senkou Span B cross, changing the cloud’s color. It can signal a potential upcoming trend reversal.
5 effective Ichimoku cloud trading strategies for beginners
After understanding the components and how to read the charts, the next step is to apply them to specific trading strategies. Ichimoku cloud provides a variety of signals, but for beginners, focusing on a few core strategies helps build confidence and a solid foundation. These strategies combine signals from different components to create a trading system with a higher probability of success. Below are 5 basic yet highly effective strategies.
Trend trading when price is above/below the Kumo cloud
This is the most basic and safest strategy when using Ichimoku cloud. The core principle is: “the trend is your friend.” You only look for trading opportunities that align with the main trend identified by the Kumo cloud. If the price is steadily moving above the cloud, this confirms a strong uptrend. In this case, you should only look for buy signals. Any downward pullbacks toward the cloud can be considered opportunities to join the trend.
Conversely, when the price is firmly below the cloud, the market is in a clear downtrend. At this time, you should focus solely on sell signals. Any upward retracement toward the cloud can serve as a potential entry point for a short position. Trading inside the cloud should be limited, as it indicates market indecision. Following this rule helps you avoid unpredictable volatility and only participate when the market has a clear direction.
Finding buy/sell signals with the Tenkan-sen and Kijun-sen cross
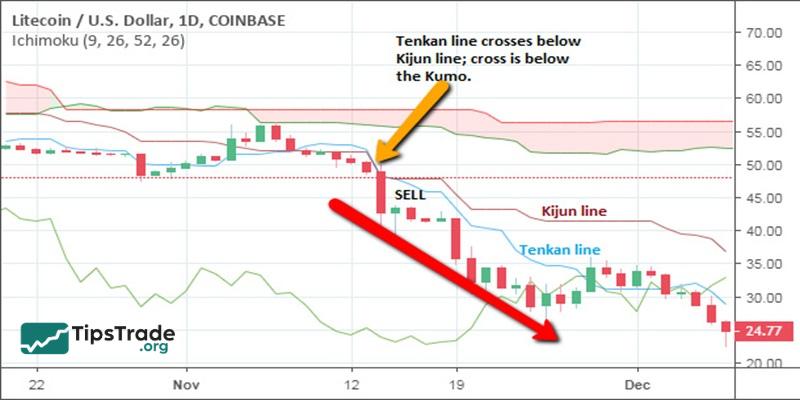
The cross between Tenkan-sen (the fast line) and Kijun-sen (the slow line) is one of the most common trading signals in the Ichimoku cloud system. This signal is similar to moving average crossovers but is more sensitive. A buy signal occurs when Tenkan-sen crosses Kijun-sen from below. This indicates that short-term momentum is stronger than the medium-term trend, signaling a potential price increase.
Conversely, a sell signal forms when Tenkan-sen crosses Kijun-sen from above. This shows that short-term momentum is weakening and sellers may be gaining control. However, it is important to consider the context of the crossover. The signal is strongest when it aligns with the main trend. For example, a buy signal (upward cross) while the price is above the Kumo cloud is far more reliable than when the price is below the cloud.
Breakout strategy from the Kumo cloud for trade entries
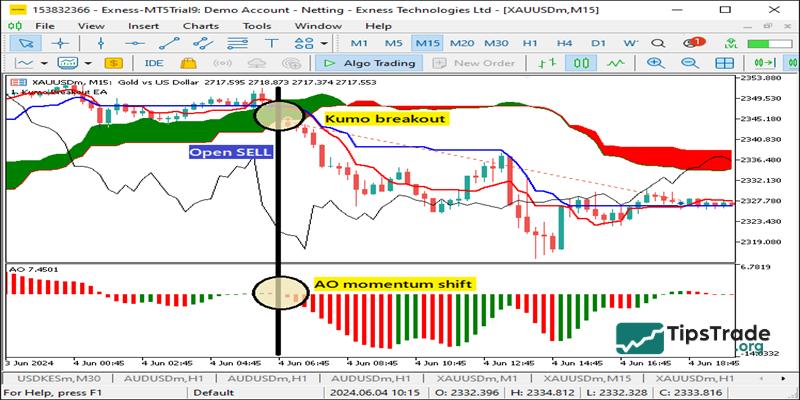
Trading breakouts from the Kumo cloud is a powerful strategy, often signaling the start of a new trend or the continuation of an existing trend after a consolidation period. A buy signal occurs when the price moves from inside or below the cloud and closes decisively above it. This is called a bullish “Kumo Breakout,” indicating that buyers have fully taken control of the consolidation area and a new uptrend may begin.
Similarly, a sell signal occurs when the price breaks from inside or above the cloud and closes strongly below it. This is a bearish “Kumo Breakout,” signaling that sellers have gained control and a new downtrend may be forming. To increase reliability, traders often wait for a few confirming candles after the breakout and check the position of the Chikou Span to ensure the signal is valid.
Using the Chikou Span to confirm signal strength
The Chikou Span (Lagging Line) serves as the final confirmation filter for Ichimoku trading signals. Because it is shifted 26 periods into the past, it allows you to visually compare the current closing price with past price action. A buy signal (such as a Tenkan-Kijun cross or a Kumo breakout) is considered strong if, at that moment, the Chikou Span is above the price line from 26 periods ago and is not obstructed by past candles.
Conversely, a sell signal is reinforced if the Chikou Span is below the price line from 26 periods ago. If the Chikou Span is entangled with past candles, it indicates potential resistance areas, making the trading signal weaker. Being patient and waiting for confirmation from the Chikou Span helps traders avoid false signals and only enter trades with the highest probability of success.
Trading pullbacks using the Kijun-sen as dynamic support/resistance
In a strong trend, prices rarely move in a straight line. Instead, they often experience corrections or “pullbacks” before continuing the trend. The Kijun-sen (Base Line) is an excellent tool for identifying potential entry points during these pullbacks. In an uptrend (price above the Kumo cloud), the Kijun-sen acts as dynamic support. Traders can look for buying opportunities when the price pulls back to touch the Kijun-sen and shows signs of bouncing upward.
In a downtrend (price below the Kumo cloud), the Kijun-sen serves as dynamic resistance. A good selling opportunity may arise when the price retraces upward, touches the Kijun-sen, and then starts to fall again. This strategy allows traders to join an ongoing trend at a better price than chasing the market after it has moved too far. It is a strategy that requires patience but offers a highly attractive risk-to-reward ratio.
Guide to setting up the Ichimoku cloud on TradingView and MT4
Installing the Ichimoku cloud indicator on popular trading platforms like TradingView and MetaTrader 4 (MT4) is extremely simple. Modern trading platforms provided by brokers often come with these tools pre-installed, allowing traders to access and use them with just a few clicks. Below is a detailed guide for each platform so you can quickly set up your charts.
The default Ichimoku settings (9, 26, 52) were originally suggested by Goichi Hosoda, based on the working and business cycles in Japan at that time. Although markets have evolved, these parameters are still widely used and have proven effective across multiple time frames. For beginners, keeping the default settings is the best choice to become familiar with the system. Once you gain experience, you can experiment with different settings to see if they better suit your trading style.
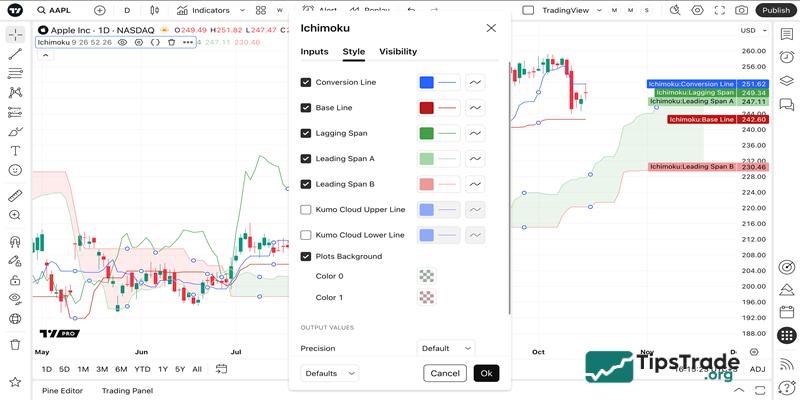
Guide to setting up the Ichimoku cloud on TradingView
- Open the chart of the financial instrument you want to analyze.
- On the top toolbar, click on “Indicators.”
- In the search box, type “Ichimoku Cloud” or “Ichimoku Kinko Hyo.”
- Click on the “Ichimoku Cloud” result from the list. The indicator will immediately appear on your chart.
- You can click the gear icon (Settings) next to the indicator name to customize colors and parameters if needed.
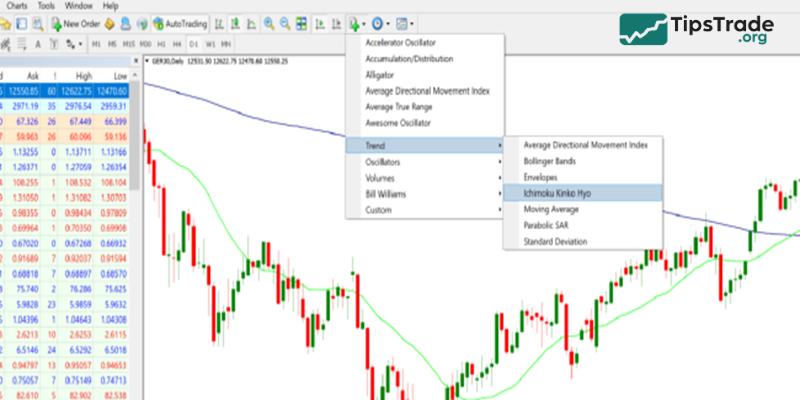
Guide to setting up the Ichimoku cloud on MT4 (MetaTrader 4)
- Open the MT4 platform and select the chart you want to analyze.
- On the main menu, choose “Insert” → “Indicators” → “Trend.”
- From the list of trend indicators, select “Ichimoku Kinko Hyo.”
- A settings window will appear. In the “Parameters” tab, you can adjust the Tenkan-sen, Kijun-sen, and Senkou Span B values (default is 9, 26, 52).
- In the “Colors” tab, you can customize the colors for each line and the cloud as desired.
- Click “OK” to complete the setup, and the indicator will be added to your chart.
Final words
The article above from Tipstrade.org provides information about the Ichimoku cloud and the top 5 effective trading strategies using this indicator for beginners. We hope this knowledge helps investors apply the Ichimoku cloud to improve their trading performance.
See more:
- What is the CCI indicator? Formula for calculating CCI in technical analysis
- Support and Resistance: The Foundation of Price Action in Financial Markets
- Stoch RSI: An Accurate Overbought/Oversold Indicator Often Overlooked by Traders
- What is Chaikin Money Flow? Learn how to use it for measuring buying and selling pressure