
Candlestick charts are one of the most widely used tools in technical analysis. Understanding how to read candlestick chart helps investors identify trends, forecast price movements, and make more accurate investment decisions. Below is a detailed guide on how to read candlestick chart for investors to reference.
Overview of candlestick charts
What is a candlestick chart?
Simply put, a candlestick chart is a powerful analytical tool that primarily helps traders observe and analyze price movements and fluctuations in the market through historical price patterns. Moreover, experienced investors can use candlestick charts to anticipate future price levels over a certain period, thereby identifying optimal opportunities to enter trades more effectively.
Basic structure of a candlestick
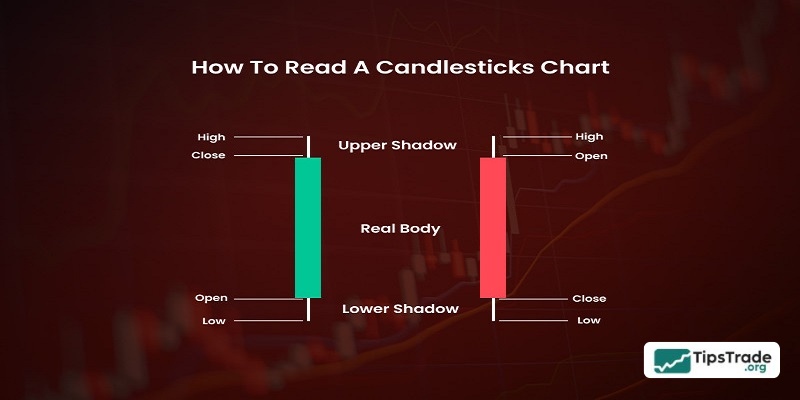
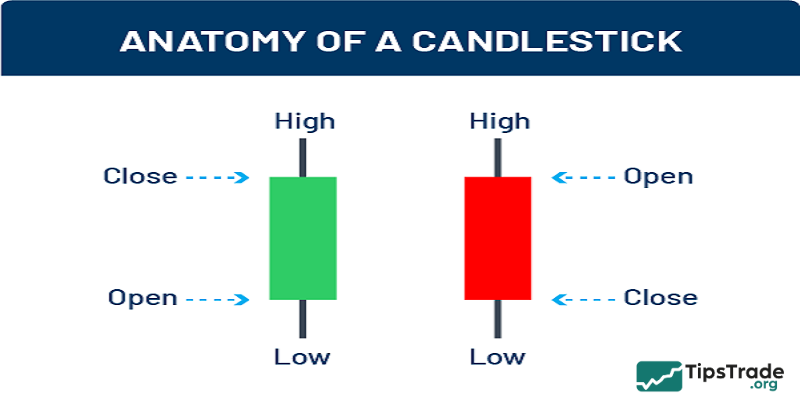
In a candlestick chart, price movements are represented by many individual candlesticks.
Each candlestick consists of two main parts: the candle body and the candle shadows (wicks).
- The candle body is usually the largest part of a candlestick and represents the opening and closing prices.
- The candle shadows are located above and below the body, known as the upper shadow and lower shadow. These parts represent the highest and lowest prices of the market within a specific time frame.
In addition, candlestick charts typically use two basic colors: green and red, in which:
- Green represents a market with an upward price trend.
- Red represents a market with a downward price trend.
How to read candlestick chart in detail for beginners
How to read candlestick chart requires investors to develop certain ways of thinking and acquire specific knowledge. Although many beginners find learning how to read candlestick chart quite difficult at first, the reality is not as challenging as it seems. Once you enter the financial market (such as forex, crypto, stock,…), reading candlestick charts becomes a daily task that every trader must practice and master until it becomes second nature. Therefore, if you consistently repeat the habit of analyzing candlestick charts, the process will gradually become much easier and may even feel routine.
Based on the information provided, we can see that different trading schools or approaches lead to different market perspectives and analytical methods. In other words, reading candlestick charts largely depends on each trader’s strategy as well as the timing they choose for their trades.
Reading candlestick charts means that we must first identify three essential factors:
- Time frame
- Trading volume
- Technical indicators
The time frame refers to the period selected by the user according to their trading objectives. Each bar or candlestick represents a specific amount of time set by the trader. For example, if a 15-minute time frame is selected, each candlestick will represent 15 minutes of price movement.
Trading volume represents the number of shares or contracts traded in the market within the time frame that the investor has chosen.
Technical indicators are supporting tools whose primary function is to assist traders in performing technical analysis.
Details on how to read candlestick chart effectively
The process of reading Japanese candlestick charts typically includes three basic and essential steps:
- Identifying the market trend.
- Analyzing the strength of the trend (strong or weak).
- Determining the appropriate time to enter a trade, as well as to take profit or cut losses.
Determine the price trend of the trading market
To begin reading Japanese candlestick charts, we should start by identifying the market price trend. This can be considered an indispensable foundational step in building a trading session with a high probability of success.
We can rely on the following basic methods to identify price trends more easily and effectively:
- Dow theory
- EMA lines
- Trendlines
- Price channels
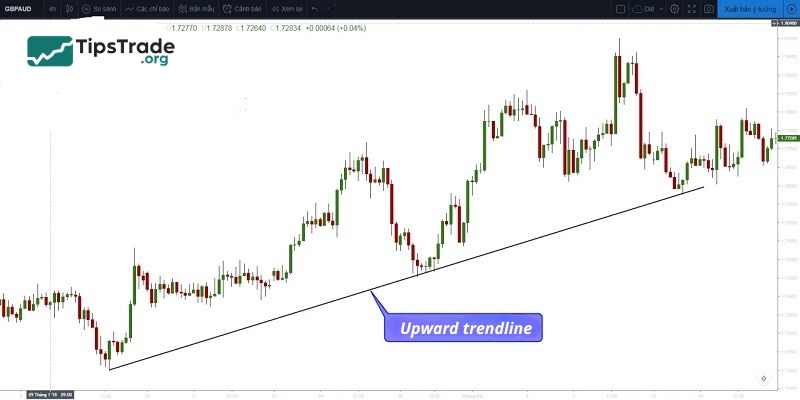
Example of applying a trendline to identify price direction:
Below, Tipstrade.org will illustrate a method for identifying price trends that is both simple and highly effective. However, this approach is best suited for investors with many years of experience in the financial market, as price movements are highly volatile, do not follow a fixed standard, and constantly fluctuate, forming unpredictable waves.
Analyzing and determining trend strength (Strong or weak)
The next step in how to read candlestick chart is to analyze whether the current trend is strong or weak. This is also a crucial step that helps investors identify suitable entry and exit points, as well as decide whether they should participate in a trading session by evaluating the strength of the trend.
Below are some methods that can be applied to analyze price trends:
- Elliott wave
- Price patterns
- Supporting technical indicators
Applying price patterns to analyze market trend strength:
Price patterns are a tool that has become very familiar in the financial market. Therefore, Tipstrade.org uses this tool to make the process of identifying trends simpler and more practical. Generally, there are two main types of price patterns: continuation patterns and reversal patterns. Depending on market conditions and price momentum, traders can consider and apply the appropriate pattern to determine trend strength.
Continuation patterns signal that prices are likely to continue moving upward or downward in line with the previous market trend. In contrast, reversal patterns indicate a potential change in direction, moving opposite to the prior uptrend or downtrend.

Identifying entry points and timing for stop loss, take profit
To complete the process of reading candlestick charts, the final step is to determine the entry point as well as the optimal stop-loss and take-profit levels. This is widely considered one of the most challenging steps, as it often causes even experienced traders to struggle. This step is decisive for the outcome of your trading session, so you must be extremely cautious, carefully study the market, and observe price movements thoroughly in order to minimize risks as much as possible. Once a clear and favorable opportunity appears, you should promptly place your order in a well-planned manner to achieve the desired profits.
In summary, this step requires traders to be patient, meticulous, and well prepared. In addition, investors should keep in mind that they should strictly avoid trading in sessions where patterns have not yet fully formed, as such situations can involve many unpredictable risks.
Conclusion
Hopefully, through this article from Tipstrade.org, you can clearly understand how to read candlestick chart in the financial market and apply them successfully in practice. Stay tuned for more articles from Tipstrade.org to learn more about financial investment knowledge!