
Draw trendline TradingView is one of the most fundamental skills every trader should master to analyze market trends effectively. Trendlines help identify the overall market direction, key support and resistance zones, and potential entry or exit points. In this guide, you will learn how to draw trendlines correctly on TradingView and apply them to improve your technical analysis and trading decisions.
What is trendline?
Before learning how to draw trendline TradingView, you need to understand the concept of what a trendline is.
Trendline is a straight line that helps traders identify the future price trend of the market in a clear and simple way. A trend refers to the movement of price in a specific direction over a long period of time. Trading with the trend means trading in the direction of price movement, which is essentially trading in the direction of the main capital flow – the overall supply and demand in the market.
See more:
- What is TradingView? A Platform Providing Visual Charts for Traders
- How to Use TradingView Mobile App for Beginners
- TradingView Stocks: A Guide to Analysis and Identifying Precise Entry Points
- How to Sign Up TradingView Account? Step-by-Step Guide
How to identify an accurate trendline
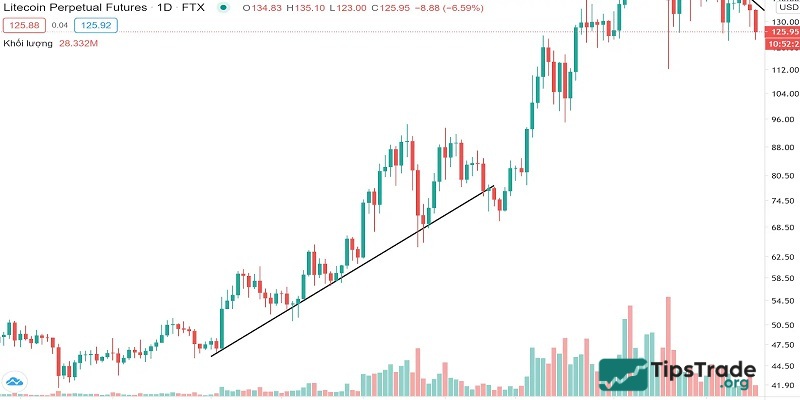
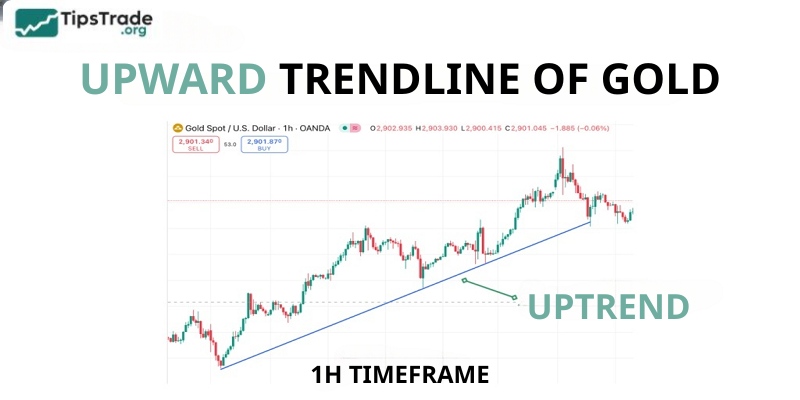
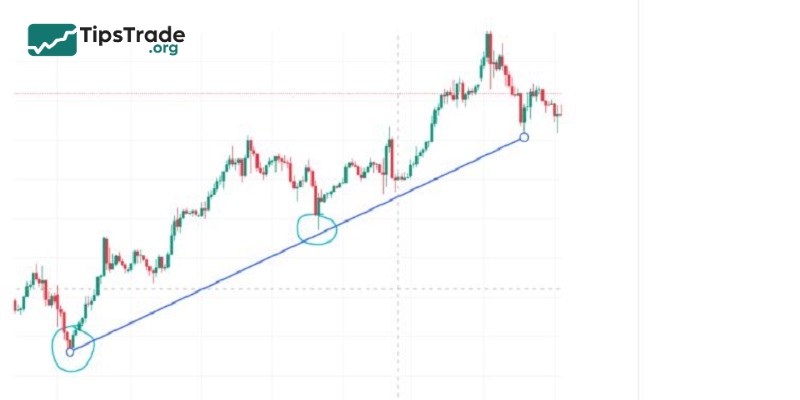
To find an effective trendline, you need to identify two key points on the price chart, either two highs (resistance levels) or two lows (support levels). Then, connect them with a straight line and extend it forward to track future price movements.
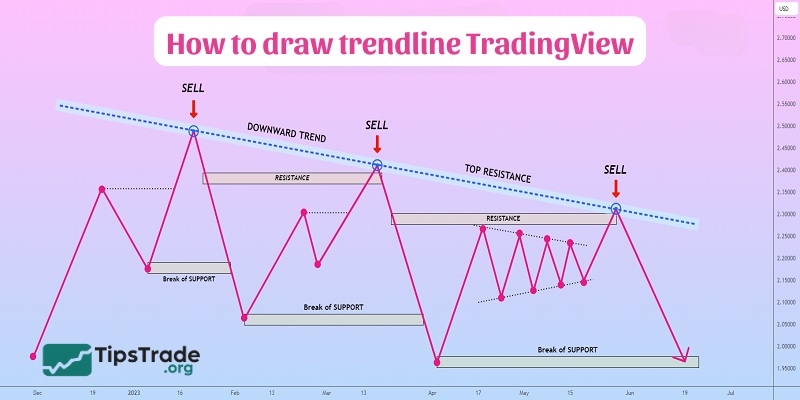
A trendline is considered reliable when the price reacts to it multiple times, showing that the market respects it as a dynamic support or resistance level.
Trendlines help traders:
- Identify the trend: Help traders recognize the main market direction.
- Find entry points: Assist in determining reasonable buy and sell points.
- Detect trend reversals: When the price breaks the trendline, it may signal a potential trend change.
Types of trends in the market
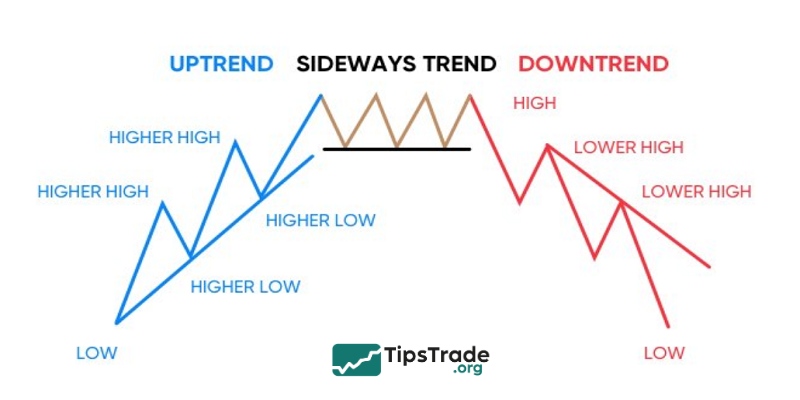
As we know, the market has three trends: uptrend, downtrend, and sideway. Where:
Uptrend
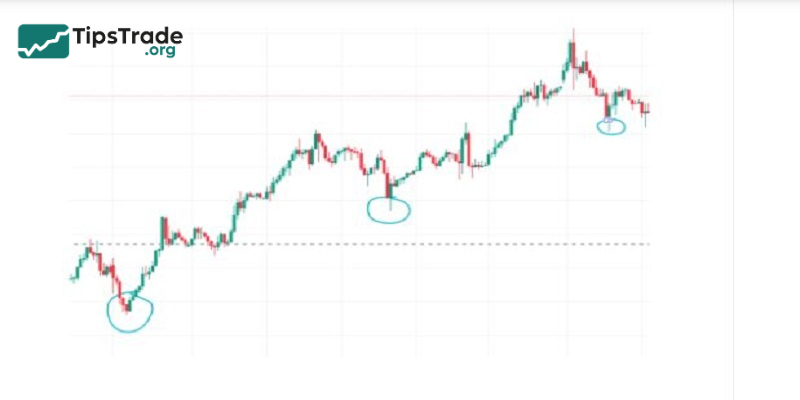
In an uptrend, the price tends to form higher highs (HH) and higher lows (HL). In this case, the trendline is drawn by connecting the lows, creating an upward-sloping line.
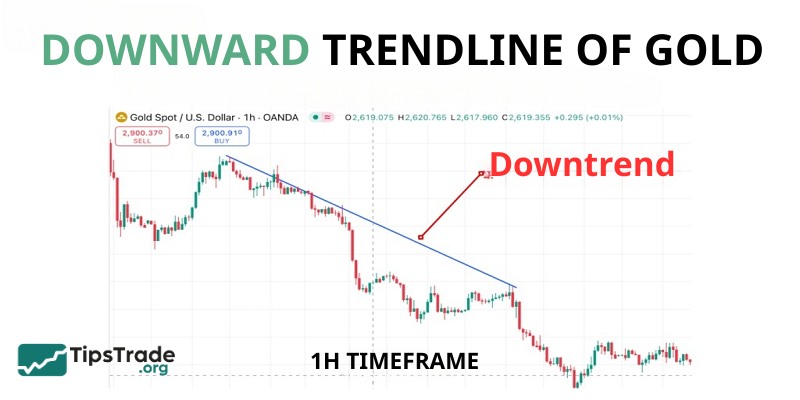
Downtrend
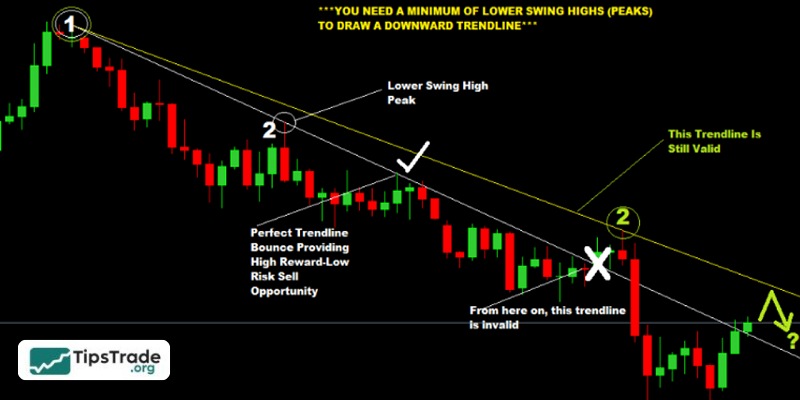
In contrast, in a downtrend, the price continuously forms lower lows (LL) and lower highs (LH). The trendline is drawn by connecting the highs, forming a downward-sloping line.
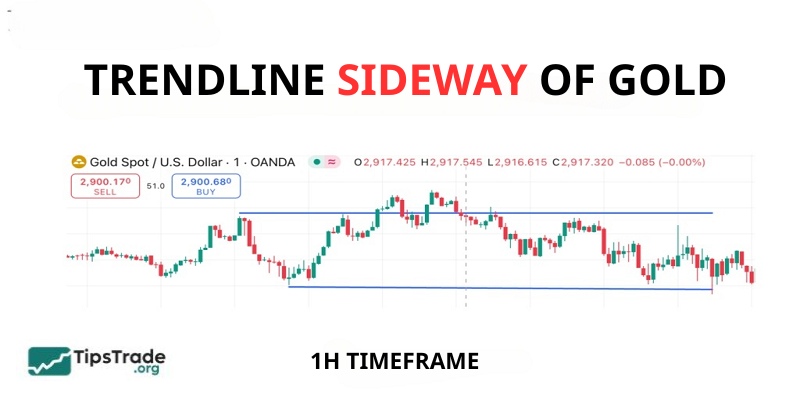
Sideways market
The market is considered trendless when the price moves within a certain range without forming higher highs or lower lows. In this situation, trendlines can be used to identify support and resistance zones rather than a clear trend.
How to draw trendline TradingView
Here are detailed instructions on how to draw trendline TradingView:
Step 1: Identify key points
- For an uptrend: Select at least two significant lows and draw a line connecting them.
- For a downtrend: Select at least two significant highs and draw a line connecting them.
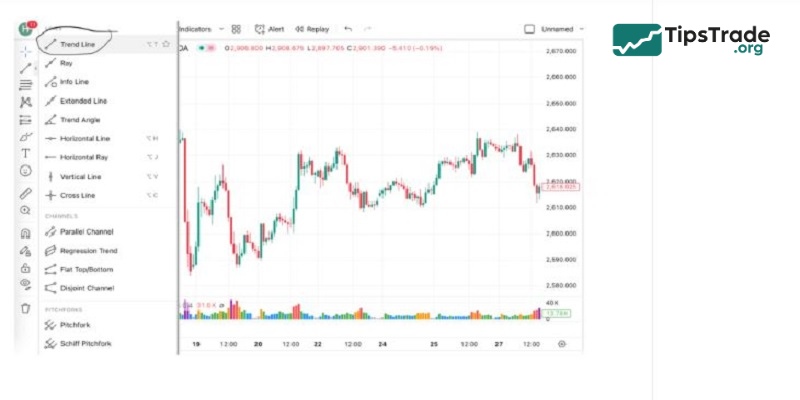
Step 2: Open TradingView and select the trendline tool
- Go to TradingView and open the chart of the currency pair, stock, or asset you want to analyze.
- On the left toolbar, select the Trendline tool icon.
Step 3: Extend the trendline
- Extend the trendline to observe the long-term trend more easily.
- Adjust it if necessary to match price movements more accurately.
Step 4: Confirm a valid trendline
- A trendline must be touched at least twice to be meaningful.
- The more times the price touches the trendline without breaking it, the more reliable the trendline becomes.
Pros and cons of how to draw trendline TradingView
Trendlines are useful but not perfect. Here is a complete, balanced perspective:
Pros
- Helps identify market direction: A quick way to determine whether the market is bullish, bearish, or range-bound.
- Clear entry and exit signals: Breakouts and bounces provide actionable trade setups.
- Risk management tool: Trendlines help traders place logical stop-loss levels.
- Simple yet powerful: Even beginners can use them effectively with a bit of practice.
- Works across timeframes: Trendlines remain relevant whether you’re trading crypto, stocks, forex, or commodities.
Cons
- Subjective interpretation: Two traders may draw different trendlines based on which swing points they select.
- False breakouts: Price may fake a breakout and quickly reverse, trapping traders.
- Limited accuracy in choppy markets: Sideways, volatile markets make trendlines less predictable.
- Overreliance risk: If traders rely only on trendlines, they may overlook volume, fundamentals, or macro trends.
=> Trendlines must always be part of a broader trading system, not a standalone tool.
Notes when drawing trendlines on TradingView
To draw trendline TradingView accurately and effectively, here are some important points you need to know:
- You need at least two points to draw a trendline, but three or more points are required to confirm its effectiveness.
- The more times a trendline is tested, the higher its reliability.
- Do not treat a trendline as an exact line; instead, consider it as a flexible support or resistance zone.
- Combine trendlines with other tools such as support and resistance levels and technical indicators to make more accurate trading decisions.
Final words
Mastering how to draw trendline TradingView will help you improve your trading strategy, increase accuracy in analysis, and limit risk. Practice regularly to master this tool and apply it effectively in real trading!
See more: