

How Fundamental Analysis Works is a systematic approach used by investors to evaluate a company’s intrinsic value through financial data and economic factors. This method involves examining financial statements, market conditions, and industry trends to predict future performance and identify investment opportunities. Visit tipstrade.org and check out the article below for further information
How Fundamental Analysis Works
Fundamental analysis is a method used by investors to determine the intrinsic value of a company and decide whether a stock is overvalued or undervalued.
Instead of focusing on short-term price movement, fundamental analysis studies the business behind the stock—its revenue, profits, assets, leadership, competitive advantage, and financial ratios.
This approach is widely used by long-term investors, especially in value investing strategies inspired by Warren Buffett and Benjamin Graham. In practice, fundamental analysis works by examining financial statements, measuring performance with ratios, and comparing valuation to market price.
If the market price is lower than the intrinsic value, the stock may present a buying opportunity. If it’s higher, investors may avoid or sell. Many professional analysts rely on audited data, SEC filings, and objective indicators, which makes this method more transparent and reliable than purely speculative trading.
Although it requires time and knowledge, fundamental analysis helps investors make informed decisions based on real financial performance rather than emotion.
see more:
- Fundamental Analysis and Technical Analysis: Choosing the Right Approach for Investors
- Risks of Fundamental Analysis: A Complete Beginner-Friendly Guide
- Everything to know about fundamental analysis methods in trading
- Free Cash Flow (FCF): Meaning, Formula, and Why It Matters for Investors
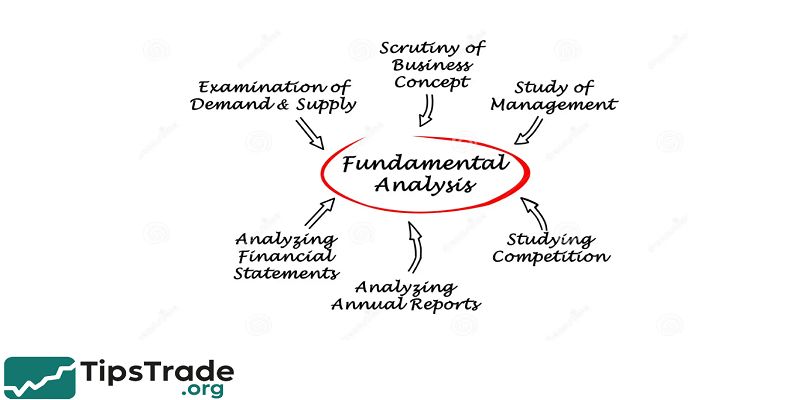
What Is Fundamental Analysis?

Fundamental analysis is the process of evaluating a company’s real financial health to estimate its intrinsic value. Instead of predicting price movement through charts, this method studies measurable data such as revenue, earnings per share, profit margin, and debt levels.
Academic sources such as CFA Institute describe fundamental analysis as an objective technique used to determine whether a security is fairly valued. The key idea is simple: if a company’s fundamentals are strong, its stock price should grow in the long run.
Investors use annual reports, 10-K filings, and audited financial statements to understand how a business makes money and whether that performance is sustainable. The method is popular among long-term and value investors because it focuses on real business results, not short-term market noise.
When people search “how fundamental analysis works,” they usually want clarity on how professionals calculate intrinsic value and decide whether a stock is worth buying.
By understanding fundamentals, individual investors reduce risk, avoid speculation, and make decisions based on measurable evidence rather than emotion or hype.
How Fundamental Analysis Works in Practice

Fundamental analysis works as a step-by-step process. Investors start by understanding how a company earns revenue, what it sells, who its customers are, and whether it has a competitive advantage.
After that, analysts review financial statements to measure profitability and stability. The data is then converted into financial ratios, which help compare performance across different companies or industries.
Finally, valuation models such as P/E, P/B, or discounted cash flow (DCF) determine the intrinsic value of the stock. If intrinsic value is higher than the market price, the stock may be undervalued and attractive to buy.
This method is widely used by portfolio managers, pension funds, and institutional investors because it reduces emotional decision-making. In practice, fundamental analysis also considers external factors like interest rates, inflation, or industry growth.
Many financial platforms such as Yahoo Finance, Reuters, and MarketWatch provide standardized data, making it easier for individual investors to perform their own analysis.
The process is detailed, but it helps investors avoid speculation and make decisions based on evidence.
Step 1 – Analyzing the Business Model
A good fundamental analysis always starts with understanding the business model.
For example, companies like Apple or Coca-Cola benefit from strong brands and repeat purchases, giving them stable long-term revenue. Investors also consider the industry: Is it growing, saturated, or declining? A company with modern products and high demand naturally has stronger earnings potential. Analysts also look at competitive advantages, often called “economic moats”—technology, patents, supply chain efficiency, or unique product features.
Morningstar, a well-known financial research firm, regularly ranks companies based on moat strength. By reviewing annual reports, earnings calls, and investor presentations, analysts can judge whether a business model is sustainable or vulnerable.
A company with a weak business model may still show temporary profits, but long-term investors focus on durable growth and long-lasting revenue streams, not short-lived trends.
Step 2 – Evaluating Financial Statements
Financial statements are the core of fundamental analysis.
Investors typically study three main documents: the Income Statement, Balance Sheet, and Cash Flow Statement. The Income Statement shows revenue, cost, and profit, allowing investors to assess whether earnings are growing.
The Balance Sheet reveals total assets, liabilities, and shareholder equity, helping investors evaluate financial stability.
The Cash Flow Statement shows whether a company generates real cash, which matters because a business can report profits but still struggle with liquidity. According to Investopedia and CFA Institute, healthy companies usually show consistent revenue growth, controlled debt, strong cash flow, and improving profit margins.
Real analysts pay attention to trends across several years, not just one quarter. For example, a company with rising debt but slow revenue growth may face risk if interest rates increase.
By reviewing financial statements, investors avoid buying stocks based only on hype or media speculation. Instead, decisions rely on verified numbers published in audited financial reports.
Step 3 – Using Financial Ratios
Financial ratios help investors compare performance and valuation between companies, even if they operate in different industries or regions.
Key profitability ratios include Gross Margin, Operating Margin, and Net Profit Margin. Liquidity ratios such as the Current Ratio or Quick Ratio measure whether the company can pay short-term obligations.
Efficiency ratios like Inventory Turnover or Asset Turnover show how effectively the business uses its resources. One of the most widely used ratios in valuation is the Price-to-Earnings (P/E) ratio, which compares stock price to earnings per share.
A lower P/E compared to industry average may indicate undervaluation. Debt-to-Equity helps investors evaluate financial risk, while Return on Equity (ROE) shows how efficiently management uses investor capital.
Professional analysts rarely rely on a single ratio; instead, they look for consistent patterns across multiple indicators.
For example, a company with high growth, strong cash flow, and a reasonable P/E ratio may be more attractive than a competitor with weak margins and heavy debt. Ratios make performance easier to compare objectively.
Step 4 – Calculating Intrinsic Value
Intrinsic value represents what a stock is truly worth based on the company’s real financial performance.
While market price fluctuates with news and sentiment, intrinsic value focuses on long-term fundamentals.
One of the most trusted valuation methods is Discounted Cash Flow (DCF), which estimates the present value of future cash flows. Although DCF requires assumptions, it is widely used by financial analysts, hedge funds, and investment banks.
Many investors also use simpler valuation metrics such as P/E, P/B, and PEG to estimate whether a stock is overvalued or undervalued.
For example, Benjamin Graham, author of “The Intelligent Investor,” used earnings-based valuation formulas to identify attractive buying opportunities. If intrinsic value is higher than the market price, the stock may be undervalued. If lower, it may be risky.
Websites like Morningstar and GuruFocus publish fair value estimates that investors can use as references. Understanding intrinsic value helps investors avoid emotional decisions and focus on long-term financial reality.
Step 5 – Making the Investment Decision
Once analysis is complete, investors must decide whether to buy, hold, or sell. This decision is not based only on price changes, but on fundamental data.
If the company shows strong revenue growth, healthy balance sheets, improving margins, and a valuation below intrinsic value, buying may be reasonable.
When fundamentals weaken—declining earnings, rising debt, or negative cash flow—investors may reduce position size or exit. Institutional investors often combine fundamental analysis with risk management tools like diversification and position sizing.
They also monitor economic conditions such as interest rates, inflation, and industry competition. Even after purchasing, analysts continue to track quarterly earnings and major business developments.
Fundamental analysis is not a one-time activity; it is a continuous process of reviewing data and adjusting strategy. This disciplined approach helps investors avoid hype-driven markets and stick with companies that deliver real financial performance over time.
Components of Fundamental Analysis
Fundamental analysis includes both quantitative and qualitative factors. Quantitative analysis uses numbers—revenue, profit, cash flow, debt, and ratios—to measure business performance objectively.
Qualitative analysis evaluates non-numerical factors such as brand strength, leadership quality, corporate governance, and market position.
For example, a company may show strong financial results today, but if management is weak or the product becomes outdated, future earnings can drop. Many research reports from McKinsey and Deloitte emphasize that sustainable growth depends on more than financial metrics; corporate culture and innovation also matter.
Analysts also consider macroeconomic factors such as interest rates, political stability, inflation, and global demand.
When both qualitative and quantitative elements align—strong numbers, strong leadership, and strong demand—the company is more attractive for long-term investment. A balanced approach gives investors a clearer picture than focusing on financial statements alone.
Key Indicators Investors Examine

When investors study how fundamental analysis works, they quickly learn that certain indicators matter more than others. Revenue growth shows whether the business expands its customer base.
Earnings per share (EPS) indicates how much profit belongs to each shareholder. Profit margins reveal cost efficiency, while free cash flow measures real liquidity. Investors also examine debt ratios because high debt increases financial risk in periods of rising interest rates.
Competitive advantage—often called a “moat”—is another critical factor. Companies like Microsoft or Johnson & Johnson maintain market share because of strong branding, patents, or innovation.
Research from Harvard Business Review shows businesses with durable competitive advantages often outperform the market in the long run. Analysts also review dividend history, expansion plans, and insider ownership to understand management confidence.
These indicators help investors distinguish between stable companies and risky, speculative stocks.
Financial Ratios Used in Fundamental Analysis
Financial ratios simplify complex data and make comparison faster. Below is a short table summarizing common ratios:
| Category | Ratio Examples | Purpose |
| Profitability | Net Margin, ROE, ROA | Measures earnings strength |
| Liquidity | Current Ratio, Quick Ratio | Ability to pay short-term debt |
| Valuation | P/E, P/B, PEG | Determines fair value |
| Leverage | Debt-to-Equity, Interest Coverage | Measures financial risk |
These ratios matter because they reveal business health without reading thousands of pages of reports. For example, a company with strong revenue but declining margin may lose pricing power. A company with low debt-to-equity is more stable during economic downturns.
Investors rarely rely on one metric; instead, they combine ratios to create a full picture. Many educational sources such as Investopedia and corporate finance textbooks recommend comparing ratios with industry averages for more accurate conclusions.
When used correctly, ratios help investors avoid emotional decisions by focusing on objective numbers.
Fundamental vs Technical Analysis
- Fundamental and technical analysis serve different purposes. Fundamental analysis studies business performance to determine intrinsic value and long-term potential. Technical analysis focuses on price charts, patterns, and trading volume to predict short-term movement.
- Long-term investors, hedge funds, and value investors prefer fundamentals because they rely on real data and audited performance. Day traders and short-term speculators often prefer technical signals.
- Neither method is perfect; many professionals combine both.
- For example, an investor may identify a strong business through fundamentals but use technical charts to find a better entry price. Studies published by academic journals like the Journal of Finance show that long-term market performance is strongly driven by earnings and financial strength, which supports fundamental investing.
- Understanding both methods allows investors to choose a strategy suited to risk tolerance, time horizon, and investment goals.
Common Mistakes in Fundamental Analysis
Many beginners make predictable mistakes when learning how fundamental analysis works. One common error is relying on a single financial ratio without studying the full picture. A low P/E does not guarantee a safe investment if earnings are declining.
Another mistake is ignoring debt; companies with high leverage can collapse when interest rates rise. Some investors only focus on revenue growth, but profits and cash flow matter even more. Others trust media hype instead of reading financial statements.
Warren Buffett once stated that investors should buy businesses they fully understand, not companies they hope will succeed. Another mistake is ignoring macroeconomic risks such as inflation or regulatory changes.
Too much confidence can lead to overpaying for stocks. Successful investors remain objective, patient, and willing to change decisions when data changes.
Who Should Use Fundamental Analysis?
Fundamental analysis is ideal for long-term investors, especially those who follow value investing, dividend investing, or retirement planning.
Unlike short-term trading, this method suits investors who prefer stable companies with durable earnings.
Many financial advisors recommend fundamentals for beginners because it teaches how businesses operate, how profits are generated, and how risk is controlled. Pension funds, mutual funds, and asset managers rely heavily on this approach because they manage client money and cannot depend on speculation.
If someone wants to buy stocks and hold them for years, fundamental analysis offers a realistic way to choose companies with long-term potential. Investors who prefer quick profits may find this method too slow, but patient investors often benefit from compounding returns.
Pros and Cons of Fundamental Analysis

Pros
- Uses real data from audited financial statements
- Helps investors avoid emotional decisions
- Supports long-term wealth building
- Works well for evaluating stable and growing companies
Cons
- Time-consuming and requires skill
- Future earnings can still be unpredictable
- Some industries are difficult to value
- Intrinsic value estimates may vary between analysts
Even with challenges, fundamental analysis remains one of the most respected investment methods because it relies on logic, research, and financial reality.
Conclusion
How Fundamental Analysis helps investors make informed decisions by providing a clear understanding of a company’s strengths and weaknesses. By applying this approach rigorously, investors can reduce risks and select stocks with strong growth potential
see more