
The Hammer candlestick is one of the strongest reversal signals on a price candlestick chart. A new trend is often identified after this candlestick pattern appears. So, what is the Hammer candlestick? What types of Hammer patterns are there? And how can you trade effectively using this pattern? All of these questions will be answered in the article below by Tipstrade.org.
What is the Hammer candlestick pattern?
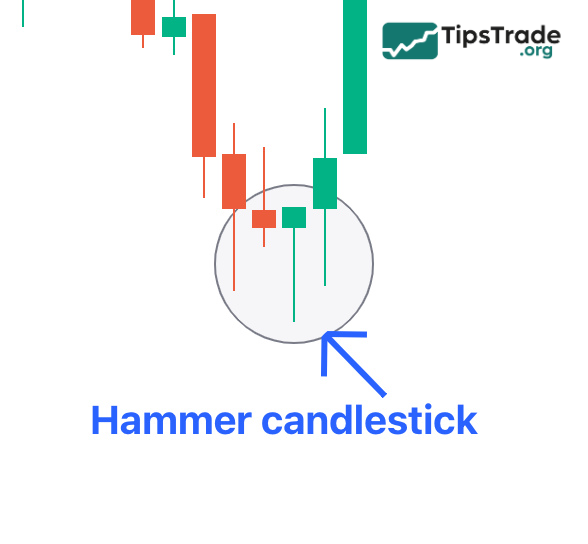
The Hammer candlestick is a reversal candle pattern in technical analysis of financial markets. It appears on the price chart and has a shape resembling a hammer with a small body and a long shadow below.
The Hammer candlestick pattern is often considered a warning signal for a price trend reversal. The Hammer candle appears after a series of declining prices and is significant in determining the market’s recovery.
See more:
- Shooting Star Candlestick Pattern: How to Identify and Trade It Effectively
- What is a Doji candlestick pattern? Common Doji candlestick patterns in investing
- What is price action? A complete guide to price action trading from basics to advanced
Types of Hammer candlestick
Although the core meaning of the hammer candlestick is to signal a potential bullish reversal, the color of the candlestick also provides additional information about the strength of the signal:
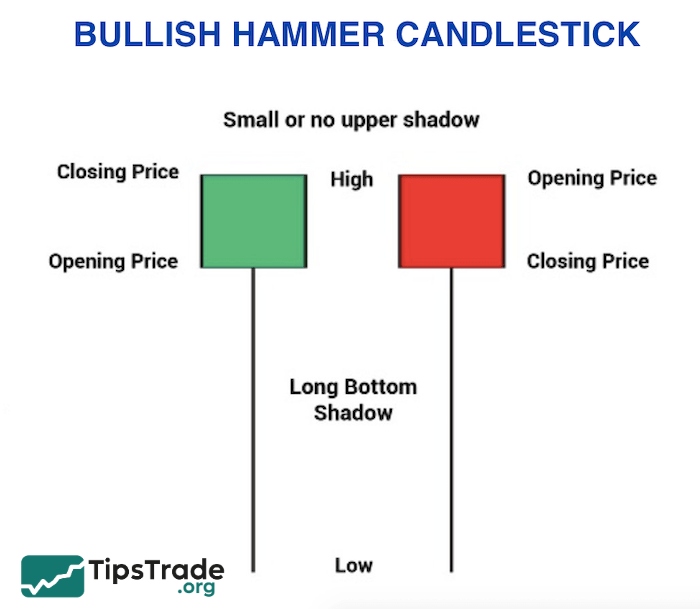
Bullish Hammer candlestick
- Occurs when the closing price is higher than the opening price (green candle body).
- This is considered a more powerful form of the Hammer candlestick because it not only shows the rejection of lower prices but also demonstrates that buyers had enough strength to push the closing price above the opening price within the same session the Hammer candle formed.
- When a green Hammer candle appears, especially if confirmed by the next bullish candle with a sudden surge in trading volume, the probability of a bullish reversal is very high. At this point, investors can consider closing their current sell orders.
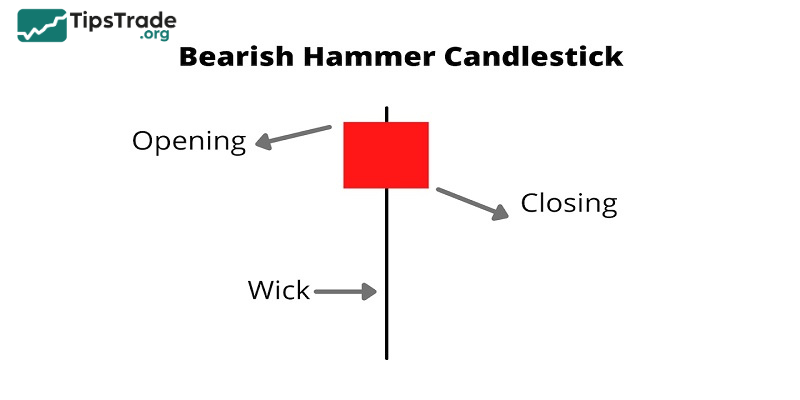
Bearish Hammer candlestick
- It occurs when the closing price is lower than the opening price (red candle body), but it still retains the characteristic structure of a Hammer candle (small body at the top, long lower shadow).
- Although it’s a bearish candle, the appearance of a red Hammer at the end of a downtrend still carries the potential for a bullish reversal. This shows that even though sellers tried to push the price down and the closing price was lower than the opening price, buying pressure was still strong enough to create a long lower shadow, rejecting significantly lower price levels.
- However, compared to the green hammer, the red hammer is often considered a slightly weaker signal. Investors should be more cautious and seek stronger confirmation factors before making trading decisions.
Identifying a Hammer candlestick
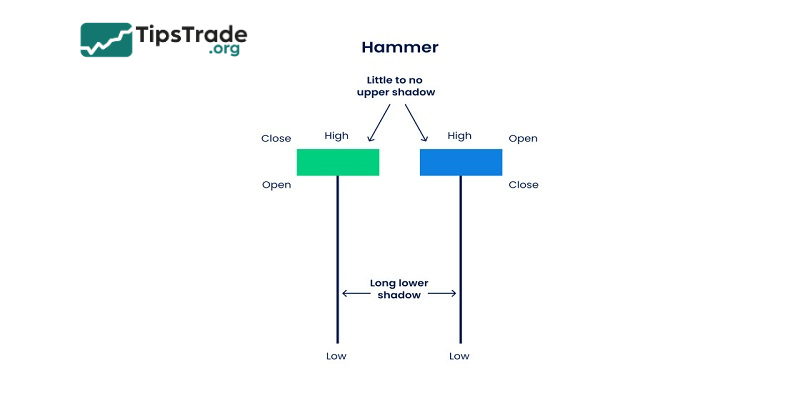
To identify a Hammer candlestick on a price chart, you need to look for candlestick patterns with the following characteristics:
- Small body: Hammer candles have a small body, typically a small portion of the price range during that time. A small body indicates a balance between buyers and sellers.
- Long lower shadow: The Hammer candlestick has a long lower shadow, indicating the strength of buyers pushing the price up after a period of decline. The long shadow below needs to be longer than the candle’s body.
- No or very small upper shadow: Hammer candles typically have no or a very small upper shadow. This indicates the dominance of buyers during that period.
When you find a candle with the above characteristics, it could be a Hammer candle. However, to confirm the signal, you should consider other factors such as the overall trend, trading volume, and other candlestick patterns during your analysis.
Meaning of the Hammer candlestick in technical analysis
The main meaning of the Hammer candlestick is a reversal signal from bearish to bullish. The Hammer candle has a small body, indicating a balance between buyers and sellers during that time. An important characteristic of the Hammer candle is the long lower shadow, indicating the strength of buyers pushing the price up after a period of decline, while the upper shadow is small or non-existent.
The Hammer candlestick pattern indicates a reversal and can predict a recovery in the price trend. This provides an opportunity for traders to buy in with the hope of capitalizing on potential price increases. However, it’s important to note that the Hammer candle isn’t always accurate, and confirmation with other factors and a detailed analysis process is crucial.
How to trade effectively with the Hammer candlestick
Step 1: Identify the pattern
- Look for a Hammer candlestick at the end of a downtrend.
- Check trading volume to confirm the signal: a Hammer is more reliable when it is accompanied by high trading volume.
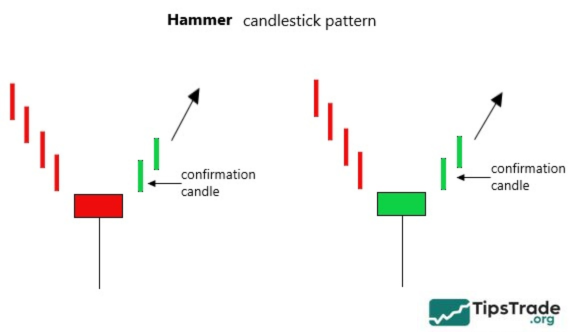
Step 2: Confirm the signal
- Wait for a bullish confirmation candle after the Hammer. This candle indicates that an uptrend is being established.
- If the following session closes above the high of the Hammer candlestick, this is considered a strong signal to enter a buy trade.
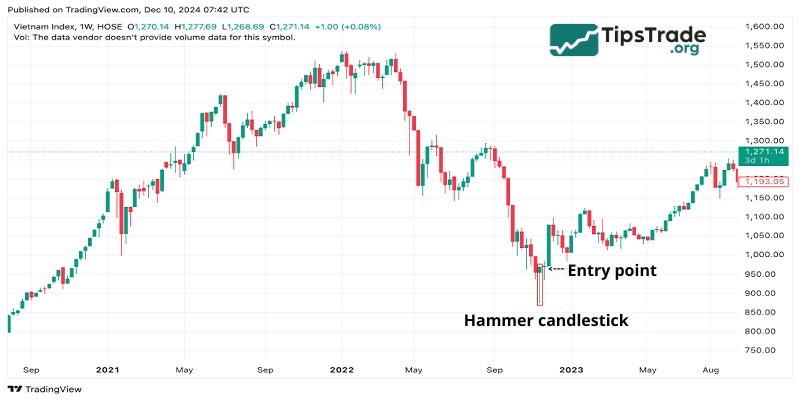
Step 3: Execute the trade
- Entry point: Place a buy order when the price breaks above the high of the Hammer candle.
- Cut loss: Place the stop-loss point just below the bottom of the Hammer candle to limit risk.
- Take profit: Determine the take profit target based on the corresponding resistance levels. Note that investors should consider the overall market trend at that time to set the most appropriate take-profit level. For example, if you determine that the overall market is in a long-term uptrend, your take-profit level can be higher; conversely, if the overall trend is only sideways, your take-profit level should be moderate.
Notes when using the Hammer candlestick in trading
In general, the Hammer candlestick is a widely used indicator. However, there are still several important points that traders should consider before placing a trade. Specifically:
- Combine with other indicators: The Hammer candlestick should not be used on its own. Traders should combine it with other tools such as RSI (to identify oversold conditions), MACD (to confirm momentum), or moving averages to increase signal accuracy.
- Be cautious of false signals: Not every Hammer candlestick leads to a reversal, especially during strong downtrends or sideways markets. Traders should only enter trades when there is a bullish confirmation candle or additional confirmation from technical indicators.
- Understand market context: The Hammer candlestick can have different meanings depending on the overall market context. For example, if the broader market is in a downtrend, the reversal signal may be weaker. Conversely, the signal is much stronger when a Hammer appears at a strong support level.
- Risk management: This is a crucial consideration when applying any trading method. Traders should set stop losses promptly if price does not move as expected to protect their capital. At the same time, avoid entering large positions if the Hammer signal has not been clearly confirmed.
Final thoughts
The above is some basic information about the Hammer candlestick and how to apply it in financial trading. The Hammer candlestick can provide important signals about market reversals and bullish trends, but they need to be confirmed by other factors to ensure accuracy. Risk management and practicing on a demo account are also very important for understanding how to use the Hammer candlestick effectively.