

Fundamental analysis stocks is one of the most traditional and time-tested methods of market evaluation. Many billionaire investors, such as Warren Buffett and Peter Lynch, have achieved great success by applying fundamental analysis in their investment strategies. However, not all investors have the patience and foresight to adopt this type of investment. In this article, Tipstrade.org will introduce the key concepts of fundamental analysis stocks. Let’s explore them together.
What are fundamental analysis stocks?
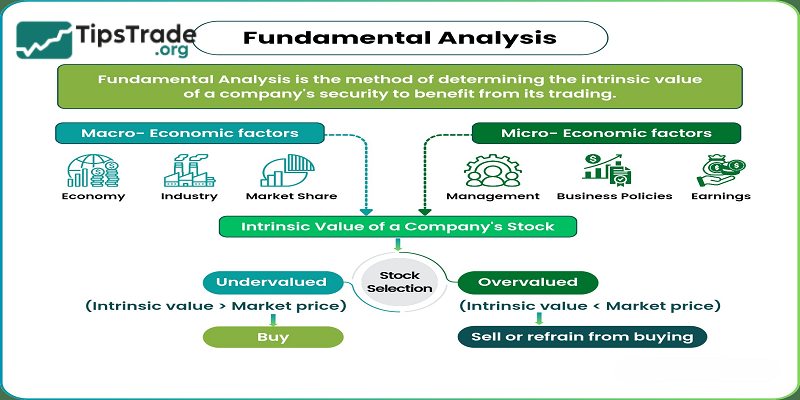
Fundamental analysis stocks is a method of measuring the intrinsic value of a stock based on the economic and financial factors of that stock.
With the fundamental analysis stocks method, investors need to consider many factors that affect stock value, from micro factors to macro factors such as the general economic situation, industry situation, domestic and world economy, government policy decisions or the company’s own performance.
Research subjects: Anything that affects the value of a stock from macroeconomic factors like the state of the economy, industry outlook to micro factors like management.
Target: Is to find a correct valuation for a stock so that investors can assess whether the stock is undervalued, overvalued or appropriate, from which they can make investment decisions.

>>See more:
- Technical Analysis for Stocks: The Complete Guide for Modern Investors
- Price-to-Earnings (P/E) ratio explained: What it is and how to use it
- What is Stock Market Index? Top 8 Stock Market Index You Should Know About
- How To Read A Stock Chart: Exploring Key Types & Pro Tips
How do fundamental analysis stocks work?
Fundamental analysis stocks base their work on the assumption that the market does not always accurately reflect a stock’s true value. The intrinsic value of a stock – the value generated by the company’s actual performance – serves as the foundation for determining its market price.
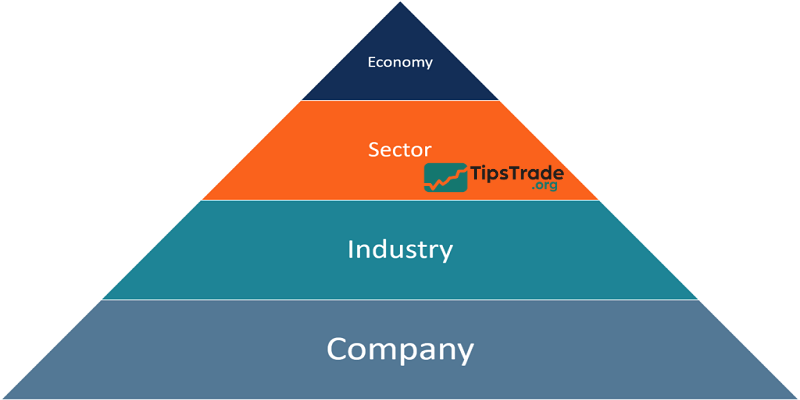
Fundamental analysis stocks is typically conducted from a macro to micro perspective to determine the intrinsic value of a company.
It uses publicly available data combined with the analyst’s assumptions to develop a valuation model that identifies the fair value of a stock.
Based on the valuation results, analysts can provide their recommendations on the stock: Buy, Sell, or Hold.
Why are fundamental analysis stocks important?
Below are the main reasons why fundamental analysis stocks play an important role in investing:
- Determine the fair value of a stock: By analyzing earnings, revenue, assets, and liabilities, investors can assess whether a stock is worth buying.
- Identify potential investment opportunities: Instead of following short-term market trends, fundamental analysis stocks help identify businesses with solid foundations and long-term growth potential.
- Support portfolio diversification: Fundamental analysis stocks allows investors to compare different industries, such as energy, technology, and healthcare, etc., thereby helping to balance risk and reward.
- Encourage rational decision making: Data-driven analysis helps investors stay calm during volatile times and avoid emotional reactions.
- Creating a foundation for a long-term investment strategy: Many institutional investors rely on fundamental analysis stocks to assess the quality of a company before investing. Without it, investment decisions can easily become speculative.

Types of fundamental analysis stocks
Fundamental analysis stocks include 4 types: qualitative analysis, quantitative analysis, Top-Down Analysis and Bottom-Up Analysis. Combining both methods helps you identify opportunities and risks more clearly when investing in stocks.
Qualitative analysis method
Qualitative refers to factors that are difficult to measure with specific data, so the analysis will depend on the views, experience and assessment of each investor.
Qualitative analysis methods in stocks will focus on factors such as:
- Business model: Even though they are in the same industry, each company will have a different strategy and business model. When you understand the nature of the model, you will know the advantages and disadvantages of the company to make smarter investment decisions.
- Industry expectations: When a field is favored by the State and widely accepted by the market, it is a favorable condition for businesses to develop sustainably in the future.
- Board of directors: Successful companies always have talented management teams, capable of outlining a long-term vision and committed to accompanying other shareholders throughout.
- Competitive advantage: Normally, if a business wants to stand firm in the market, it needs to have a unique competitive advantage such as a strong brand, low production costs, exclusive technology, good capital mobilization ability,…
- Risk level: In reality, risks from macro factors and business cycles are inevitable. An effective company will have a risk management plan to maintain stability and long-term growth.

>>See more:
- Long-Term Stock Investing: Benefits and Key Principles to Understand
- How To Buy Stocks in 4 Steps: Quick-Start Guide for Beginners
- ETF Investing: The Ultimate Guide for Beginners
Quantitative analysis method
Unlike qualitative, quantitative analysis will have clear numbers shown in financial statements.
Based on this, you can evaluate the financial situation of each business through:
- Revenue and profit: A company’s performance is shown through indicators of revenue growth, net profit margin, ROA, ROE, EPS,… This factor allows investors to find stocks that have the potential to generate profits in the future.
- Assets and capital: You look at the structure of assets, cash, debt ratio, working capital,…to know the financial health of the company. Enterprises with large capital and less debt will have the ability to expand production and develop better.
- Cash flow: This is an important factor for the company to survive, and it also reflects the company’s ability to generate money. Based on cash flow, investors can evaluate the scale and evaluate the company’s business expansion plan.
- Price indexes: When comparing the real value of a stock with its current trading price, people often use the P/E and P/B ratios. If these ratios are lower than the real value of the stock, then it is an opportunity for you to invest and make a profit from the potential stock.

Top-Down Analysis
The Top-Down method analyzes the overall picture of macro factors and the economy. As a result, investors can know which industries are benefiting from macro factors to screen stocks with growth potential.
The Top-Down method will focus on analyzing:
- GDP growth creates a favorable environment for companies to grow.
- Fiscal policy and monetary policy promote or inhibit business.
- How high/low/ideal inflation rates affect investors.
- High/low bank interest rates will cut or promote spending and investment development.
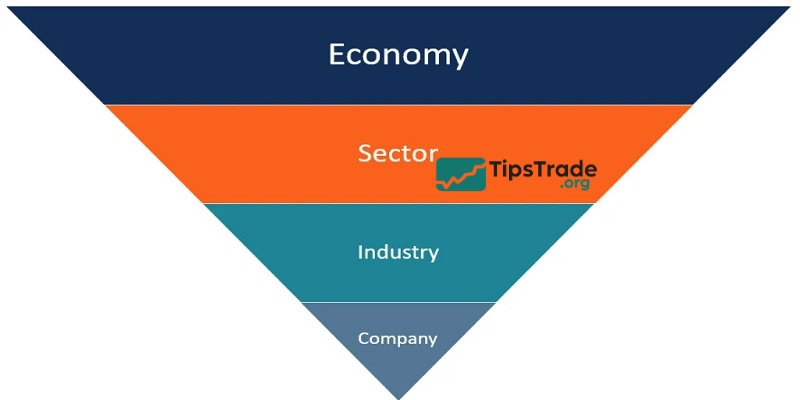
Bottom-Up Analysis
The Bottom-Up method will focus on analyzing factors originating from within the business, finding out how the business is positioned in the industry and paying less attention to external influences.
Specifically, the Bottom-Up method will be concerned with:
- Management team and board of directors.
- Products, market share and position.
- Past and predicted future profit growth.
- Financial indicators such as P/E, profit margin, debt/total assets ratio,…
- Cash flow and free cash flow used for operations and investments.
In general, all four of the above analysis methods are useful for investors. The choice of which method to use depends on preferences, strengths, and each industry.
Pros and cons of fundamental analysis stocks
Here are the pros and cons of fundamental analysis stocks:
Pros
- This method is suitable for predicting stock prices and making long-term investment decisions.
- Help investors understand the nature of the company and classify good companies to invest in.
Cons
- It takes a lot of time and effort to access and process a large amount of information.
- The degree of accuracy is limited by the dependence on the accuracy of the financial statements provided.
- Based on the analyst’s subjective assumptions.
- Ignore factors of supply and demand as well as investor psychology in the market.

Essential metrics and ratios in fundamental analysis stocks
When conducting fundamental analysis stocks, investors will need to consider many metrics and ratios to assess the value and performance of a company.
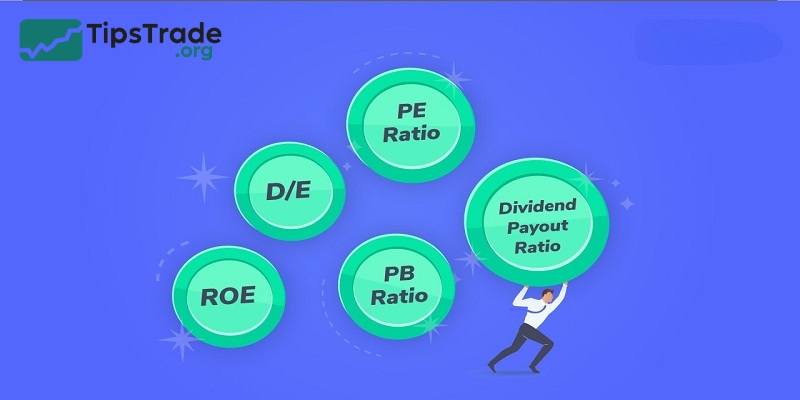
- Price-to-Earnings (P/E): Indicates the ratio of the company’s share price to its earnings per share. Calculate it by dividing the market price per share by the company’s earnings per share
- Price-to-Book (P/B): Indicates the ratio of a company’s market value to its book value. Calculate it by dividing the stock price by the company’s book value
- Debt-to-Equity (D/E): Indicates the ratio of a company’s debt in relation to its equity. Calculate it by dividing the total liabilities by the total shareholders’ equity
- Return on Equity (ROE): Measures a company’s profitability in relation to its equity. Calculate it by dividing the net income by the shareholders’ equity
- Return on Assets: Measures profitability in relation to a company’s assets. Calculate it by dividing net income by the total assets
- Earnings per share: Refers to a company’s profitability per share of its stock
- Dividend yield: Refers to how much the company pays to its shareholders
Steps to start fundamental analysis stocks
Typically, the fundamental analysis stocks process will go through the following 4 steps:
Step 1: Macroeconomic analysis
Investors begin by looking at overall economic conditions such as inflation, interest rates, GDP growth, exchange rates, and government policies. These factors have a direct impact on the performance of businesses. For example, when interest rates rise, industries such as real estate and banking are often under pressure.
Step 2: Industry analysis
Each sector has its own cycle and characteristics. Commodity sectors tend to grow strongly when global commodity prices rise, while technology stocks are more dependent on innovation and market acceptance. Understanding these trends helps investors choose sectors with better growth potential.

Step 3: Business analysis
This step involves reviewing the financial statements:
- Balance sheet: to evaluate assets, liabilities and capital structure.
- Business performance report: to measure profitability and revenue trends.
- Cash flow statement: to assess liquidity and cash flow generation.
In addition to the numbers, investors also need to consider the quality of the management, expansion strategy, governance standards and the company’s competitiveness compared to rivals.
Step 4: Determine intrinsic value
Based on both quantitative and qualitative data, investors estimate the intrinsic value of a stock. Some common valuation methods include:
- P/E Ratio (Price to Earnings): compare stock price to earnings per share.
- P/B Ratio (Price to Book): compare stock price to book value
- DCF (Discounted Cash Flow): calculate the present value of expected future cash flows.
This valuation result helps investors make appropriate decisions: first, hold or sell shares.
How to apply fundamental analysis stocks in trading
Here are some common applications of fundamental analysis stocks that investors can use in their investment process:
- Buy undervalued stocks: when market price is below intrinsic value.
- Sell overvalued stocks: when prices exceed fair value and risks rise.
- Select quality stocks for long-term growth: those with consistent ROE, strong cash flow, and manageable debt.
- Build a balanced portfolio: allocate across sectors based on your risk profile.
Differences between fundamental analysis stocks and technical analysis
There are many analysis methods in the stock market, but fundamental analysis stocks and technical analysis are the two main and fundamental methods for every investor. Each method has its own unique characteristics that you should be aware of, specifically:
|
Comparison Criteria |
Fundamental analysis stocks | |
|
Objective |
Determine the intrinsic value of a stock |
Identify optimal buy and sell points for stocks |
|
Analytical Information |
– Financial statements.News and events. – Company information. – Economic conditions.… |
Historical stock prices and trading volumes |
|
Analytical Factors |
– Quantitative analysis. – Qualitative analysis. |
Based on technical indicators such as RSI, MACD, Oscillator, etc., and price movements |
|
Investment Strategy |
Suitable for medium- and long-term investing |
Suitable for short-term investing |
|
Decision Basis |
Buy when the market price is below the intrinsic value, and sell when the price rises |
Price movements, trading volume, and signals from technical indicators |
In reality, choosing between fundamental analysis stocks and technical analysis will depend on your investment goals and strategy. But if possible, you should combine both methods to increase the accuracy of your investment decisions.
Conclusion
Fundamental analysis stocks is a method used by long-term investors, which involves evaluating all qualitative and quantitative factors. This is a highly accurate analysis method, but it also requires investors to know how to read financial statements, analyze them, and form their own opinions. Hopefully, the information above has given you a more comprehensive understanding of fundamental analysis stocks, allowing you to apply it effectively to your investment process.