
Fundamental Analysis and Technical Analysis represent two main approaches to evaluating financial markets. Fundamental Analysis examines the underlying economic and financial factors affecting an asset’s value, while Technical Analysis studies past market data and price patterns to predict future movements. Visit tipstrade.org and check out the article below for further information
What is Fundamental Analysis (FA)?
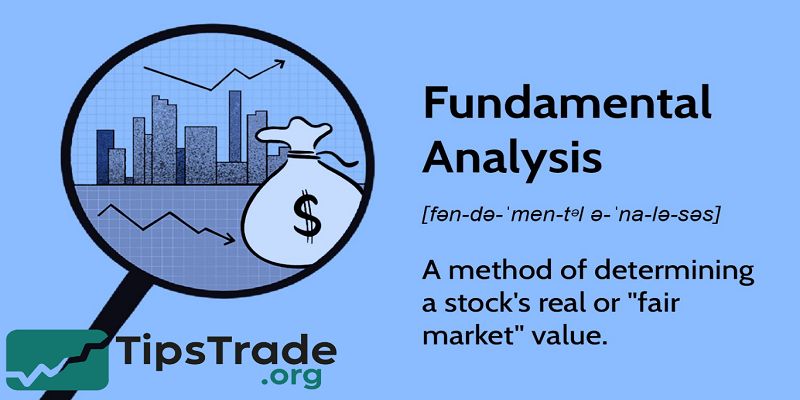
- Fundamental Analysis, or FA, is the method of evaluating a financial asset by studying the real-world factors that affect its value.
- Instead of looking at charts or price patterns, FA focuses on business performance, industry trends, news, macroeconomics, and projections of future revenue.
- This method is widely used in stock markets, long-term investing, and value investing.
- Warren Buffett, the world’s most famous investor, is known for mastering FA and buying companies based on intrinsic value, not short-term price swings.
- In practice, traders who use FA analyze elements such as revenue, earnings per share (EPS), debt, competitive advantage, and management quality.
- According to the CFA Institute, financial statements are the foundation of FA because they reveal whether a business is profitable, growing, risky, or undervalued.
- If the company’s real value is higher than the market price, FA-oriented investors may buy and hold until the price reflects true worth.
- This approach is common among long-term investors who want stable returns, low risk, and logical decision-making instead of emotional trading.
Key Components of Fundamental Analysis
Fundamental Analysis includes several important data points and financial metrics. Each one provides information about a company’s health and growth potential.
Revenue and Profit Growth
- Companies that grow steadily over time are attractive for long-term investment.
- Investors check quarterly and annual reports to see if sales and profit are increasing.
Financial Ratios
FA investors use ratios to compare companies. Common metrics include:
- P/E Ratio (Price-to-Earnings): Shows whether a stock is overpriced or undervalued.
- ROE (Return on Equity): Measures how well a company uses investors’ money.
- Debt-to-Equity: High debt means higher risk.
Macro and Industry Factors
- Even a great company can drop if the industry is dying or the economy is weak. FA considers inflation, interest rates, and political changes.
Management and Business Model
- Investors look at leadership reputation, innovation, brand strength, and competitive advantages.
- According to Nasdaq research, companies with strong fundamentals outperform weak ones during long-term economic cycles.
- This proves FA is effective for patient investors who want stability instead of volatility.
Strengths and Benefits of Fundamental Analysis
FA is trusted because it uses real data, not speculation. Investors feel more confident knowing their decisions are backed by earnings reports, audited financial results, and measurable business growth.
Benefits include:
- Logical and data-driven decisions
- Focus on long-term wealth building
- Helps identify undervalued stocks before they rise
- Provides clarity during market panic or hype
For example, during the 2020 pandemic crash, many fundamentally strong tech companies lost value temporarily. FA investors who understood business fundamentals bought at low prices and earned large returns when markets recovered.
Limitations of Fundamental Analysis

However, Fundamental Analysis is not perfect. It has weaknesses, especially in fast-moving markets like crypto or forex where prices change rapidly.
Limitations include:
- Time-consuming research
- Requires financial knowledge
- Market may take months or years to reflect true value
- Not ideal for short-term traders
In some cases, good companies fall for long periods despite strong financial reports, because market sentiment can dominate short-term pricing. This delay frustrates traders seeking quick profits.
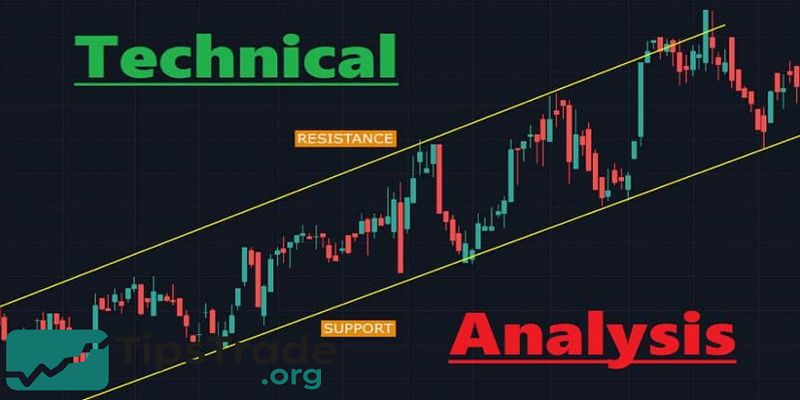
What is Technical Analysis (TA)?
Technical Analysis, or TA, studies market data such as price movement, charts, patterns, volume, and indicators to predict future price action. Instead of asking, “Is this company fundamentally strong? TA asks, “Where will the price go next?”
TA is used heavily by day traders, scalpers, swing traders, and crypto investors. Unlike FA, TA does not care about business earnings or news unless it affects price behavior. Traders believe that all information—public or hidden—is already reflected in the chart. As the famous TA concept states: Price discounts everything.
Instead of reading financial reports, TA traders watch candlestick patterns, support/resistance, trendlines, moving averages, RSI, MACD, Fibonacci levels, and volume spikes. According to Investopedia, TA is effective because markets are influenced by psychology, fear, greed, herd behavior, and liquidity. Charts reveal these emotions faster than financial statements do.
Key Components of Technical Analysis
Technical Analysis includes tools that help traders detect momentum, trends, reversals, and breakout points.
- Candlesticks – Show how price moves within a timeframe
- Support & Resistance – Areas where price bounces or rejects
- Indicators like:
- RSI (Relative Strength Index) – Measures overbought or oversold conditions
- MACD – Shows trend strength and momentum
- Moving Averages (MA, EMA) – Smooth price action for easier interpretation
- Chart Patterns – Head and shoulders, double bottom, triangles
- Volume – Confirms real price movement vs fake breakouts
Beginners find TA attractive because it works on stocks, forex, gold, crypto, and even meme coins. It is fast, flexible, and focuses on price instead of complicated financial reports.
Strengths and Benefits of Technical Analysis
Technical Analysis gives traders a structured method to manage entries and exits. Instead of buying randomly, TA users wait for signals, patterns, or confirmations before risking money.
Advantages:
- Works in all markets
- Great for short-term trading
- Fast decision-making
- Can identify trend reversals early
- Helps reduce emotional trading
For example, when Bitcoin falls to a major support level and shows bullish reversal candles with high volume, TA signals a potential buy—even if news is negative. Traders like TA because the chart reveals what traders are actually doing, not what they say they will do.
Limitations of Technical Analysis
TA is powerful, but not perfect. Traders often lose money because they misuse indicators, overtrade, or ignore risk management.
Weaknesses:
- Too many indicators can cause confusion
- Signals are not 100% accurate
- Market manipulation can create fake patterns
- Works poorly during unexpected news events
A common mistake is believing indicators predict the future. In reality, indicators only react to past price movement. Smart traders use TA as a probability tool, not a magic forecast.
Fundamental Analysis and Technical Analysis – What Are the Main Differences?
While FA studies real-world value, TA studies price behavior. Both are useful, but in different situations. The table below summarizes the key differences:
| Factor | Fundamental Analysis (FA) | Technical Analysis (TA) |
| Focus | Business performance, news, financial data | Price action, charts, indicators |
| Best For | Long-term investing | Short-term trading |
| Decision Basis | Intrinsic value | Market psychology |
| Example Tools | P/E Ratio, EPS, balance sheet | RSI, MACD, Moving Averages |
| Time Frame | Weeks, months, years | Minutes, hours, days |
| Used By | Investors, value buyers | Day traders, momentum traders |
When Should a Trader Use FA?
Fundamental Analysis is the right choice when a trader wants to invest for the long term or build a stable portfolio. FA works well when a trader wants to understand the real value and growth potential of a company.
FA is most useful when:
- Investing in stocks for years, not days
- Avoiding hype and emotional decisions
- Analyzing businesses with strong competitive advantages
- Buying during market crashes when prices are cheaper than value
Example:
If a company’s earnings keep rising every year, has low debt, and dominates its industry, FA investors buy and hold—even if the chart is not perfect today.
Research from the CFA Institute shows that companies with strong fundamentals outperform weak companies across long-term cycles, even if short-term volatility exists.
When Should a Trader Use TA?
TA is ideal for traders who care about price movement and short-term opportunities. It works in markets where fundamentals are unclear—like crypto or forex.
TA is best used for:
- Day trading and scalping
- Identifying trend entries and exits
- Detecting momentum or volume spikes
- Avoiding buying at the top or panic selling at the bottom
Example:
When price breaks above resistance with strong volume, TA signals a potential uptrend. Traders enter with a stop-loss to control risk.
According to Nasdaq trading data, over 70% of short-term market participants use TA-based strategies.
Is FA Better Than TA?
There is no universal answer. It depends on the trader’s goals. Long-term investors prefer FA because it builds wealth patiently. Short-term traders rely on TA because it provides timing and precision. Many professionals use a combination: FA to find strong assets, TA to find the best entry.
Smart approach:
- Use FA to select valuable stocks
- Use TA to time when to buy or sell
This reduces risk while increasing potential return.
Case Study – Fundamental Analysis and Technical Analysis in Real Life

Consider a popular company like Apple (AAPL). Fundamental investors analyze iPhone sales, earnings, brand strength, and innovation. FA shows Apple is a stable business with global demand. If the stock drops due to market panic, FA sees it as a temporary discount.
At the same time, TA traders look at Apple’s price chart. If it reaches a long-term support zone and RSI signals oversold conditions, TA suggests a strong buying opportunity. When both FA and TA agree, traders have higher confidence. Historical data from Nasdaq shows Apple rebounds strongly from major supports because long-term buyers step in when price becomes attractive.
This example proves FA and TA can work together instead of competing.
Common Mistakes When Using Fundamental Analysis and Technical Analysis

Even though both methods are powerful, beginners often fail because of the following mistakes:
Mistakes in FA:
- Ignoring debt or cash flow
- Blindly following social media “stock tips”
- Believing cheap price means good investment
- Holding forever without re-evaluating company health
Mistakes in TA:
- Trading based on one indicator
- Overtrading during low-volume markets
- No stop-loss or risk management
- Using too many conflicting signals
Professional traders avoid emotion, rely on data, and always manage risk.
Conclusion
Fundamental Analysis and Technical Analysis depends on investment goals and time horizons. Combining both approaches can provide a comprehensive view of market opportunities.