
Fundamental analysis is a useful tool that investors can use in the process of evaluating and making investment decisions. So, what is fundamental analysis? Let’s explore it together with Tipstrade.org in the following article.
What is fundamental analysis?
Fundamental Analysis (FA) is a method of assessing the true value of an asset such as a stock, currency or cryptocurrency by considering underlying economic and financial factors. This method helps investors determine the intrinsic value of the asset, thereby identifying investment opportunities when the asset may be undervalued or overvalued compared to its real value.
Instead of just looking at price movements, fundamental analysis takes a closer look at factors such as a company’s financial condition, operating performance, and macroeconomic factors that can affect an asset’s value, thereby predicting long-term price trends.
How fundamental analysis works across asset classes
Although the principles of fundamental analysis are the same, the application differs depending on the type of asset being considered. Here’s how it applies to different asset classes:
Stock & equity fundamental analysis
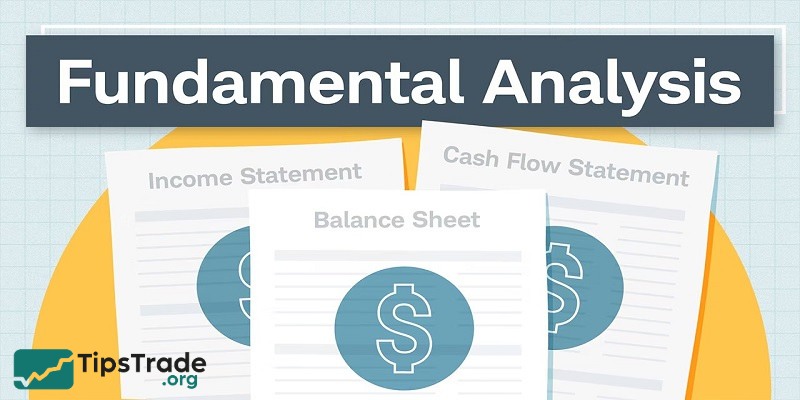
A company’s overall financial health, business model, industry performance, and future growth prospects are all key elements of fundamental analysis for stocks and equity securities. Fundamental analysis is especially important for those considering CFD trading. Investors and traders often start by looking at a company’s key financial statements.
This may include:
- Income Statement: Shows a company’s revenue, expenses, profits, and losses over a given period of time. It helps evaluate how a company generates revenue and manages costs.
- Earnings per share (EPS): EPS shows the amount of profit associated with each outstanding share. An increase in EPS is generally considered a positive sign.
- Price to Earnings Ratio (P/E): This is the relative value of a stock’s price to its earnings per share. Investors and traders can use this metric to assess whether a stock is undervalued or overvalued relative to its earnings.
- Growth forecast: Based on analysts’ estimates and company data, traders can make reasonable assessments of the future performance of the business, thereby forming long-term valuation models.
In addition to the above metrics, factors such as the strength of the management team and the company’s competitive position also help investors determine the intrinsic value of a stock.
Forex fundamental analysis
The value of a currency is influenced by the economic strength of the issuing country. Fundamental analysis in Forex looks at major macroeconomic factors that can impact the strength of a currency. Traders often use several key indicators to assess a country’s economic outlook:
- Interest rate: The interest rates set by central banks have a direct and immediate impact on the value of a currency. High interest rates tend to attract foreign capital inflows, thereby increasing the demand for that currency.
- Inflationary: Moderate inflation generally reflects positive economic activity, while high inflation can quickly erode the value of money. Central banks will adjust interest rates to control inflation, thereby influencing currency trends.
- Gross Domestic Product (GDP): GDP reflects a country’s overall economic activity. Strong GDP growth generally strengthens the currency.
- Employment and trade balance data: Figures such as employment rates, deficits and trade balances also influence currency values, reflecting the financial stability and competitiveness of the economy.
Fundamental analysis in Forex helps traders predict how central bank actions may affect currency values in the short term, as well as economic factors that determine long-term trends. Mastering these basics is a top priority for beginners in Forex trading.

Crypto fundamental analysis
Fundamental analysis in the cryptocurrency market focuses on the specific characteristics of each project rather than macroeconomic factors. This makes crypto analysis more difficult, especially for beginners, but evaluating key factors is crucial to increasing the likelihood of trading success.
Key elements include:
- Whitepaper: Present the project’s purpose, technology used, governance mechanism and development roadmap. A clear, transparent whitepaper is the basis for assessing the legitimacy and potential success of a crypto asset.
- Network index: Includes data like transaction volume, active addresses, developer activity, and hash rate. Each metric provides insight into the health and adoption of the network.
- Token utility: The token supply mechanism and how they are used in the ecosystem. The value of use will directly affect the long-term prospects of the coin.
The crypto market is highly speculative and can be volatile. Therefore, applying fundamental analysis is necessary to identify projects that have the potential to make a lasting impact.

Types of fundamental analysis
The data an analyst uses during a fundamental analysis can be quantitative or qualitative. Among them:
Quantitative analysis
Quantitative analysis is financial and economic information that can be measured. For stocks, this includes balance sheets, income statements, profit and loss statements, and financial ratios. In Forex fundamental analysis, quantitative data comes from macroeconomic indicators such as GDP growth and interest rates. For cryptocurrencies, token supply, trading volume, and blockchain usage are all quantitative indicators that can be analyzed.
Qualitative analysis
Qualitative analysis might focus on the quality of the company’s management, brand reputation, regulatory environment, and comparability to competitors. In crypto fundamental analysis, qualitative data might include an assessment of the whitepaper, the experience of the founding team, and future growth plans.
The economic reports plays a central role, especially in Forex and commodities trading. Calendar-based economic releases, such as inflation data, central bank interest rate meetings, or employment reports, can have a strong impact on market prices. Understanding how to interpret these reports helps traders predict how the market will react.
Traders also monitor news related to geopolitical volatility and shifts in public opinion, which can cause both short-term volatility and long-term trends. For example, a disappointing earnings report can lead to a rapid decline in asset prices.
Fundamental analysis approaches
The two primary approaches to conducting a fundamental analysis are top-down and bottom-up.
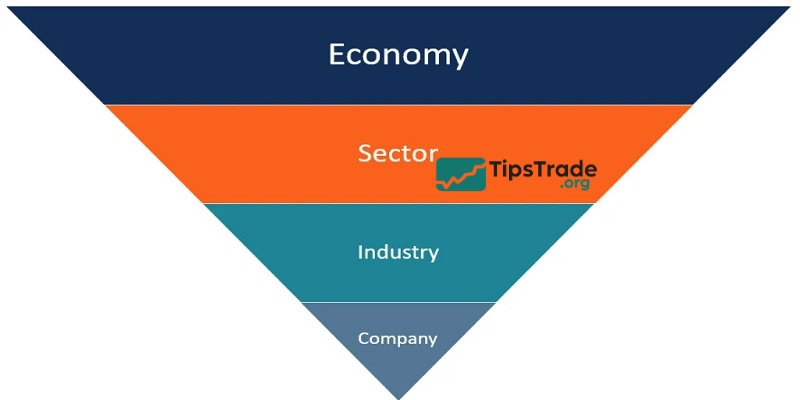
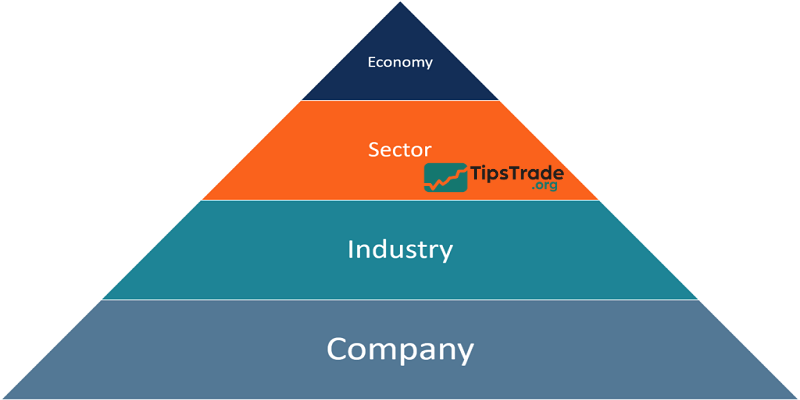
Top-down analysis
This is a method that focuses on analyzing various economic factors to get an overview of the market, then moves on to promising industries and finally selects the best performing businesses in the industry to make investment decisions.
The key factors in this approach include GDP, CPI inflation index, interest rate increases/decreases through monetary policy, public policy, government taxes or spending, business market analysis, etc.
Pros:
- Learn more about policy and economic indicators
- Diversifying portfolios in a variety of sectors
Cons:
- Not every business will perform well when their industry is growing.
- Macroeconomic indicators are constantly changing, requiring investors to constantly update the news
Bottom-up analysis
This is a method that focuses on analyzing the fundamentals of a business and selecting the business with the best growth potential in the same field, before considering market economy trends to make investment decisions
The key factors in this approach include analyzing the situation of the business through financial statements, the ability to grow and profitability through revenue, profitability as well as assessing the capacity and qualities of management.
Pros:
- Help to choose quality stocks even during periods of market volatility
Cons:
- We need to look closely at every aspect of the business.
- It is easy to ignore the importance of macroeconomic factors which can impact the long-term development of the business
Difference between fundamental and technical analysis
| Fundamental analysis | Technical analysis | |
| Target | Measure intrinsic value against market value, determine whether the valuation is high or low, and make appropriate decisions. Suitable for long-term investment. | Use price chart models in combination with other tools to predict the rise and fall of stocks. Suitable for short-term investment. |
| Data sources | Information from financial reports, economic situation, corporate financial health,… | History of prices, trading volume,… |
| Tools | Financial indicators such asSpring/Summer, P/B, EPS,… Valuation methods such as DCF, FCFF, FCFE,… | Candlestick charts, line charts, technical indicators,… |
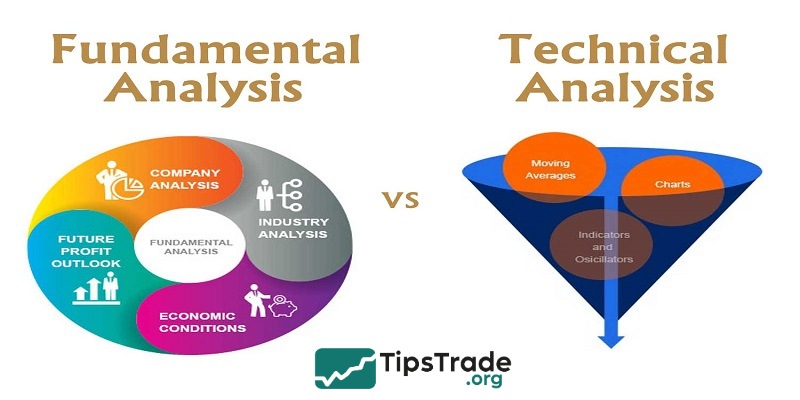
Although each method has its own advantages and limitations, many traders combine both fundamental analysis and technical analysis to gain a more comprehensive view of the market. By integrating technical signals with fundamental factors, they can make more informed trading decisions and increase their chances of success.
Conclusion
Fundamental analysis is the key to help investors make strategic and effective trading decisions. By skillfully combining fundamental analysis with other methods, investors can improve their ability to predict market fluctuations, optimize profits and steadily move forward on the path to conquering the financial market. Hopefully, the above article has provided you with complete information about fundamental analysis methods. In addition, do not forget to visit Tipstrade.org regularly to update the latest financial trading knowledge every day!