
Forex volume analysis is a crucial technique that helps traders understand market dynamics by examining the relationship between trading volume and price movements. By analyzing volume patterns, traders can confirm trends, anticipate reversals, and identify key points of supply and demand in the Forex market. Volume analysis adds depth to price action and provides insights that are not visible from price charts alone, making it an essential tool for making informed trading decisions. Visit tipstrade.org and check out the article below for further information
What is Forex Volume and Why It Matters
- In forex trading, volume represents the number of price movements, or “ticks,” that occur within a specific period.
- Unlike the stock market, where real contract volume is publicly recorded on exchanges, the forex market is decentralized. There is no single authority that reports the total number of contracts traded.
- For this reason, platforms such as MT4, MT5, or Trading View display “tick volume,” which counts how many times price changes instead of how many lots are bought or sold.
- Although this might sound less accurate, multiple studies from brokers and institutions show a strong correlation between tick volume and real volume in major currency pairs.
- High volume generally indicates strong market participation and liquidity, while low volume can signal hesitation or a lack of interest.
- Traders who analyze volume often use it to confirm trends, validate breakouts, and detect potential reversals.
- Professional traders consider volume one of the most reliable clues to market strength because prices can be manipulated temporarily, but sustained volume is difficult to fake.
- See more:
How Volume Works in the Forex Market
- Unlike centralized markets such as the New York Stock Exchange, forex transactions occur across global banks, liquidity providers, and institutional networks.
- Because there is no central reporting system, traders rely on volume data offered by their brokers.
- Tick volume measures how often price changes during a candle. If a candle shows 500 ticks, it means the price moved 500 times within that period.
- Research from the CME Group and academic studies have shown up to 90% correlation between tick volume and actual transaction volume in major pairs like EUR/USD and GBP/USD.
- This means traders can still use tick volume as a reliable proxy. High trading sessions, such as the London and New York overlap, typically produce the highest volume and stronger trend reliability.
- In contrast, the Asian session often shows lower volume, leading to false signals and ranging markets.
- Understanding these volume cycles helps traders avoid weak periods and focus on the times when institutional capital is active.
- As a result, volume is not just a technical indicator—it reflects real market participation.
Benefits of Using Volume in Forex Trading
- Volume analysis helps traders make smarter decisions by revealing how much interest exists behind a price move.
- When price rises with strong volume, traders interpret it as genuine buying pressure. If price rises on weak volume, the move may be fading, and a reversal becomes more likely.
- One clear benefit is spotting fake breakouts. Many traders enter a trade when the price moves above support or resistance, but without volume confirmation, this is risky.
- A breakout with low volume often means that few market participants support the move, making it more likely to snap back.
- Another benefit is detecting reversals early. A sudden volume spike after a long trend can signal exhaustion, especially when combined with candlestick patterns.
- Many real-world trading examples show EUR/USD breaking a resistance level with strong volume and continuing another 50–100 pips afterward.
- New traders often ignore volume because it looks simple, but professionals understand that price without volume is incomplete.
- For this reason, volume is widely used in systematic and manual trading strategies.
Key Volume Indicators Used in Forex
On-Balance Volume (OBV)
- OBV is one of the oldest and most respected volume indicators.
- It adds volume when price closes higher and subtracts volume when price closes lower.
- Traders use OBV to detect momentum and identify whether volume supports price action.
- For example, if price is moving sideways but OBV is trending up, it suggests that buyers are accumulating positions silently.
- This hidden accumulation often leads to a breakout. On the other hand, if price makes new highs but OBV makes lower highs, this is bearish divergence—a sign of potential reversal.
- Many traders have observed that OBV divergence on EUR/USD or GBP/USD often predicts trend exhaustion before the chart shows any visual weakness.
- OBV is also reliable because it ignores noise and focuses only on volume flow.
- Platforms like TradingView and MetaTrader offer OBV with no extra setup required, making it a beginner-friendly tool with professional-level accuracy.
Volume Profile / Market Profile
- Volume Profile is a more advanced tool that displays how much volume is traded at specific price levels, rather than across time.
- This makes it especially useful for identifying strong support and resistance zones.
- The most important part of Volume Profile is the Point of Control (POC), which marks the price level with the highest volume.
- Traders assume that institutions are most active near the POC, making it a powerful magnet for price.
- Another feature is the Value Area, where 70% of trading activity occurred.
- When price breaks out of the Value Area with rising volume, it often starts a new trend.
- Traders who backtested this method on EUR/USD noticed that pullbacks to high-volume zones frequently produce strong reactions, allowing risk-reward ratios of 1:2 or 1:3. Although Volume Profile looks complex, it provides deep insights that traditional indicators cannot show.
- It helps traders avoid emotional decisions by focusing on real market participation.
Volume Weighted Average Price (VWAP)
- VWAP is popular among institutional traders because it measures the average price of an asset based on both price and volume.
- When the price is above VWAP, the market is generally bullish; when the price is below, it is bearish.
- Many professional traders use VWAP as a dynamic support-resistance line.
- In forex, VWAP is particularly useful during high-volume sessions like London and New York.
- Traders often combine VWAP with breakouts: if price breaks key resistance and stays above VWAP with increasing volume, the trend is more trustworthy.
- VWAP prevents traders from chasing price because it shows whether the market is overextended.
- On gold (XAU/USD), VWAP filters often reduce false breakouts caused by news.
- Although retail traders may overlook VWAP, it remains a backbone of algorithmic trading desks because it reflects institutional cost levels.
Money Flow Index (MFI)
- The Money Flow Index blends price and volume to measure buying and selling pressure.
- Unlike RSI, which uses only price, MFI includes volume to show whether money is truly flowing into or out of an asset.
- Readings above 80 suggest overbought conditions, while readings below 20 signal oversold.
- Traders often notice that MFI divergences are more reliable than RSI divergences because volume is harder to manipulate.
- For example, if EUR/USD makes new highs but MFI forms lower highs, the trend might be weakening.
- MFI works well in ranging markets, where volume cycles reveal accumulation and distribution.
- Many traders use MFI as a confirmation tool when combining it with candlestick patterns or moving averages.
- While no single indicator is perfect, MFI adds an extra layer of validation that price alone cannot provide.
Forex Volume Trading Strategies That Actually Work
- Forex volume analysis becomes powerful when traders apply it with clear rules.
- The most effective strategies use price action and volume together rather than relying on indicators alone.
- One simple example is the “Volume Breakout Strategy.” A breakout above resistance looks strong only when volume rises sharply. If price moves up but volume is weak, professional traders often avoid entering because the move may fail.
- On major pairs like EUR/USD or USD/JPY, true breakouts almost always show multi-bar volume spikes during London or New York sessions.
- Traders using this method often place stop-loss orders below the breakout zone to limit risk.
- Another practical approach is “Volume + Pullback Confirmation.” When price trends upward, pullbacks with lower volume suggest that sellers are weak, and the uptrend may continue.
- Many backtests show that combining trendlines with declining pullback volume improves win rates, especially in trending markets.
- These strategies work because they reflect real market behavior: strong moves require participation from institutional traders, and volume reveals whether they are active or not.
Breakout Strategy Using Volume
- Breakouts are exciting, but they are also where beginners lose the most money.
- Many retail traders enter instantly when price breaks above a resistance area, only to see the market reverse.
- Volume filters out fake moves. In a bullish breakout, strong volume signals real buying pressure.
- If volume increases steadily before and after the breakout, institutions are likely adding positions.
- In contrast, a breakout with low volume often results from stop-hunting or thin liquidity.
- Traders experienced in EUR/USD and gold (XAU/USD) notice that when volume is weak, the market often snaps back into the range.
- A practical example: if price breaks 1.0900 on EUR/USD with volume 40–60% above the weekly average, the chance of continuation is much higher.
- Traders may target 1–2 times risk or trail stops below structure.
- Confirmation matters: volume rising, candle closing outside resistance, and no immediate rejection wicks.
- Without volume, breakouts are guesses; with volume, they are strategic entries.
Pullback Strategy with Volume Confirmation
- Pullbacks are essential in trend trading because they offer better entry prices than chasing candles.
- Volume helps identify whether a pullback is healthy or dangerous.
- In an uptrend, pullbacks with declining volume show that sellers are weak, meaning buyers will likely regain control. But if pullback volume rises sharply, the trend may be losing strength.
- Traders often apply this to GBP/USD or USD/CAD during strong market conditions.
- For example, if the market trends upward and the next pullback shows 30–40% lower volume than previous candles, many traders prepare for a continuation.
- Confirmation may come through bullish engulfing patterns, moving average support, or VWAP bounce.
- This technique works because real reversal requires strong volume, and without it, the retracement usually fades.
- Pullback + volume analysis gives cleaner entries, smaller stop losses, and less stress than chasing trends blindly.
Volume Divergence Strategy
- Volume divergence occurs when price moves in one direction, but volume moves in the opposite direction.
- For example, if price forms higher highs but volume declines, the trend may be running out of momentum.
- Many professional traders consider this one of the earliest reversal signals.
- Volume divergence works well on major pairs and gold during the New York session, when liquidity is highest.
- Traders often combine divergence with RSI or MACD for confirmation. If EUR/USD pushes to a new high on low volume and RSI shows overbought conditions, the chance of reversal increases.
- Stop-loss orders can be placed above recent highs, and profit targets set at previous support.
- The advantage of divergence trading is timing: it warns traders before trend reversal becomes visible on price action alone.
- However, false signals can occur in slow sessions such as the Asian market, so time filtering is important.
Wyckoff Volume Principles Explained Simply
- Richard Wyckoff was one of the earliest analysts to use volume and price to understand institutional behavior.
- His method is still widely used in forex, stocks, and crypto.
- The core idea is that markets move through phases of accumulation, markup, distribution, and markdown.
- Volume helps identify which phase the market is in. During accumulation, price moves sideways while volume slowly increases.
- Institutions buy quietly to avoid moving the market. In the markup stage, price rises with strong volume, confirming demand.
- Distribution happens when institutions begin selling to late buyers, and volume spikes again.
- Finally, during markdown, price falls with increased volume as selling pressure dominates.
- Traders who study Wyckoff often use volume spikes, spring patterns, and tests to time entries.
- A real example is GBP/USD forming accumulation at a major support after economic news.
- Once volume increased and price broke resistance, the pair rallied strongly. Wyckoff remains relevant because it focuses on real market forces, not just indicators.
Accumulation and Distribution Using Volume
- Accumulation is a phase where smart money buys slowly at low prices. Price usually moves in a tight range with occasional volume spikes.
- These spikes often appear at the bottom of the range, where institutional traders absorb sell orders.
- Distribution is the opposite: institutions sell to retail traders who enter late. Volume spikes often appear near the top as demand fades.
- Traders watching EUR/JPY noticed this pattern during quiet market periods: long sideways movement, low volatility, and sudden volume increases.
- When price broke the range with strong volume, the next trend began.
- Identifying accumulation and distribution helps traders avoid chasing trends.
- Instead of reacting emotionally, they wait for volume confirmation and enter with confidence.
- Many advanced traders use Volume Profile to see where the most trading occurred, adding clarity to Wyckoff patterns.
- Understanding these phases improves timing, reduces losses, and aligns trading with professional activity
Common Mistakes Traders Make When Using Volume

- Volume analysis is powerful, but many traders apply it incorrectly and end up misreading the market.
- One of the most common mistakes is assuming that every volume spike signals a trend. In reality, volume can spike during news events, stop hunts, or liquidity grabs, without forming a real trend.
- Traders who enter too quickly often get trapped by false breakouts.
- Another mistake is analyzing volume during low-liquidity times, such as the Asian session.
- Because fewer institutional traders are active, volume becomes unreliable and price often moves in slow ranges.
- A third error is using volume alone without price action. Volume must be paired with structure: support, resistance, trendlines, and candlestick patterns
- Without context, volume data becomes confusing. Many beginners also misunderstand tick volume, thinking it is less important than real volume.
- However, research shows strong correlation between tick volume and actual institutional activity on major pairs.
- To avoid mistakes, traders should test strategies on demo accounts, track sessions, and combine volume with confirmation tools like VWAP or OBV. Proper volume analysis removes guesswork, but only when traders respect market structure.
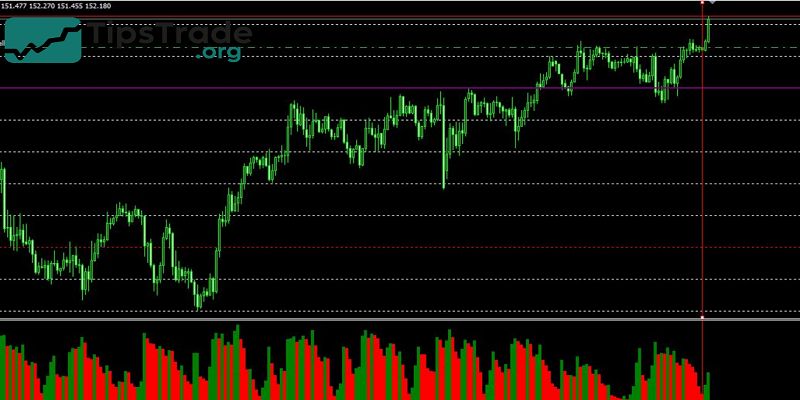
How to Read Volume Bars and Candles
- Reading volume correctly requires understanding how volume interacts with price movement.
- When a large bullish candle forms with high volume, it often shows strong buying interest.
- But if a bullish candle forms on low volume, the move may lack support and could reverse.
- Likewise, a bearish candle with high volume shows aggressive selling pressure.
- Traders often compare current volume levels to the average of previous candles to measure strength. If volume is rising gradually while price trends upward, the trend is healthy.
- If price rises but volume decreases, momentum is fading. Long-wick candles with high volume can signal rejection — institutions may be absorbing orders.
- On EUR/USD, traders frequently see long wicks during news releases: price spikes briefly, volume surges, and then the market returns to balance.
- Learning to read volume and candle interaction helps traders differentiate emotional spikes from real institutional participation.
- This skill becomes clearer with screen time, backtesting, and session-based analysis.
- Volume is not just a number — it is a reflection of market commitment.
Volume and Market Sessions (London, New York, Asia)
- Volume levels change drastically depending on the trading session.
- The London session generates the highest average volume for major currency pairs.
- Liquidity is strong, spreads are tighter, and trends form more cleanly.
- When London overlaps with New York, volume reaches peak levels — this is where most breakouts occur.
- Professional traders often focus on this overlap because institutional orders, hedge fund activity, and economic reports create powerful moves.
- In contrast, the Asian session is quieter. Volume is lower, pairs usually move sideways, and false signals occur more frequently.
- Many traders lose money by forcing trades during this session. Instead, volume analysis helps them identify when to avoid the market.
- For example, GBP/USD may move only 15–25 pips during Asia but expand to 80–120 pips once London opens.
- Understanding session-based volume helps traders time entries more accurately.
- Volume is not the same 24 hours a day — and knowing when institutions are active provides a major edge.
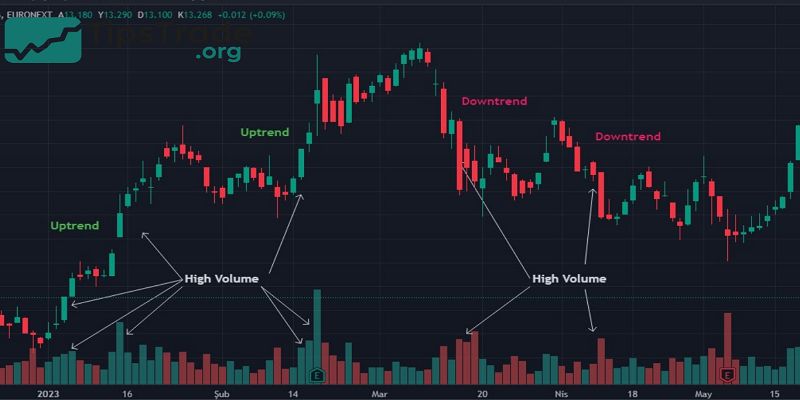
Volume in Uptrends vs Downtrends
- Volume behaves differently depending on trend direction. In healthy uptrends, price makes higher highs while volume gradually increases.
- Buyers step in during pullbacks, and volume confirms continuation.
- But if price climbs while volume weakens, the uptrend may be losing strength — especially near resistance zones.
- Downtrends also rely on volume confirmation. When price drops with strong volume, sellers are in control.
- But if the price falls with low volume, it may only be a correction. Many traders watch volume spikes near the end of a long trend.
- For example, when EUR/USD trends down for several days and suddenly forms a large volume spike with a reversal candle, it often signals capitulation — the last push before a trend change.
- Volume helps traders detect whether the move is real or just noise.
- Combining volume with trend structure gives clearer entries, better stop placements, and stronger risk-reward ratios.
Comparing Volume Behavior Across Instruments
- Although volume exists in all markets, its meaning changes depending on structure. In stocks, volume comes from centralized exchanges like NASDAQ or NYSE.
- Every trade is recorded, so traders see exact contract volume. In crypto, volume comes from multiple exchanges, but still reflects real transaction numbers.
- In forex, the market is decentralized — this is why traders use tick volume. Surprisingly, multiple studies show that tick volume correlates strongly with real volume, especially on major pairs.
- Because forex is the largest financial market, liquidity is deep and price moves efficiently when volume increases.
- In comparison, small-cap stocks or low-liquidity crypto coins show extreme spikes because a small number of traders can move prices significantly.
- Traders transitioning from stocks to forex must understand this difference.
- In forex, volume does not show exact lots traded, but it reliably reflects market participation and liquidity flow.
- This is why professional forex traders continue using volume as a core part of technical analysis.
Tools and Platforms for Volume Analysis
- Volume analysis becomes easier with the right trading tools. On MetaTrader 4 or 5, traders can view volume bars directly on charts.
- Tick volume is displayed below each candle, and indicators like OBV, MFI, and Accumulation/Distribution are available by default.
- TradingView offers more advanced visual tools, including Volume Profile, VWAP, and custom scripts that highlight high-volume nodes.
- Many traders prefer TradingView because it displays volume heatmaps, footprint charts, and session volume.
- For execution, ECN brokers provide more accurate tick volume data because they connect directly to liquidity providers.
- Beginners often overlook the importance of broker data quality — poor tick volume can distort analysis. Some traders add volume alerts to notify them when volume spikes, making it easier to catch breakouts early.
- Even mobile platforms now support basic volume indicators. You don’t need expensive software to start — just a reliable charting platform and a broker that provides clean data.
When Volume Signals a False Move

- Volume is powerful because it exposes manipulation and weak price action.
- A common sign of a false move is when price breaks support or resistance but volume remains low.
- Without participation from large players, breakouts often fail. Another warning sign is a sudden volume spike followed by a sharp reversal — often caused by stop hunts or news events.
- For example, during low-liquidity hours, algorithms may push price briefly above key levels, triggering stop orders, then reverse.
- Traders who chase these moves lose quickly. In downtrends, if price rallies with weak volume, sellers are still dominant, and the trend may resume lower.
- Many traders use volume filters to avoid “fake volatility” during Asian sessions, pre-news consolidation, or holiday markets.
- When volume doesn’t match price action, it’s a red flag. Professionals don’t guess — they wait for volume confirmation.
Conclusion
Forex volume analysis enhances a trader’s ability to validate price trends and detect potential market turning points through volume behavior. When used alongside other technical indicators and price patterns, volume analysis becomes a powerful strategy to improve trade timing and risk management. Ultimately, incorporating volume analysis into Forex trading leads to more accurate market interpretations and better trading outcomes.
>>See more: