
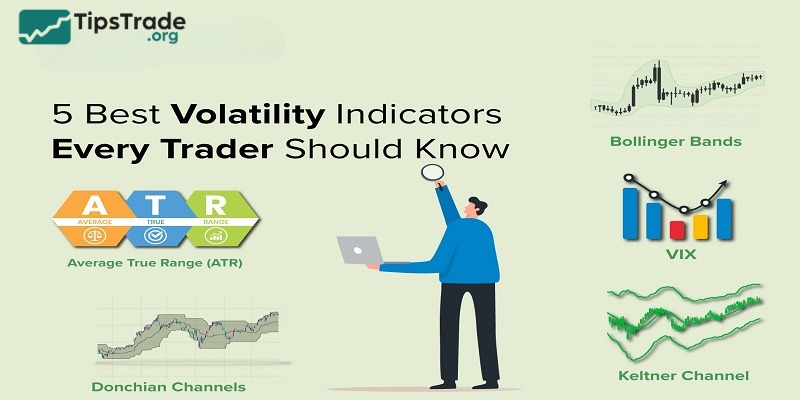
Forex volatility indicators help traders measure the degree of price fluctuation in currency pairs. From there, they can better assess risk and adjust position size. Below are the Top 5 best forex volatility indicators that traders should use in technical analysis.
What are forex volatility indicators?
The uses of forex volatility indicators are used to measure the degree of high or low market volatility. Accordingly, these forex volatility indicators help traders determine whether the price of a currency pair is fluctuating significantly over a given period. By relying on the frequency of price changes, volatility indicators support the placement of buy (long) or sell (short) orders that suit your trading style.
- In the case that you are a short-term trader, you can trade in high-volatility markets to seek quick profits.
- On the other hand, if you are a long-term trader, you may choose less volatile markets to limit the risk of large losses.
Furthermore, forex volatility indicators also help you identify whether the market is likely to reverse or continue its trend. Specifically:
- If the market signals a reversal in an uptrend, a trader can place a short order.
- If the market signals a reversal in a downtrend, a trader can place a buy (long) order.
>>See more:
- Explore top 5 best indicators TradingView
- Top 10 best MT5 technical indicator for successful trading
- Discover the top 6 indicators in MT4 that are widely used
How to use forex volatility indicators effectively
Effective use of forex volatility indicators can help traders make better trading decisions and manage risk, thereby capitalizing on potential opportunities to profit in the market. In the content below, Tipstrade.org will share some ways you can apply them to improve your trading strategy:
Identify market conditions
- Bollinger Bands: When the bands expand, this reflects increasing volatility, signaling the potential for breakouts or strong price movements. Conversely, when the bands narrow, it’s a sign of low volatility, often appearing before a period of accumulation or a potential reversal.
- Average True Range (ATR): Use ATR to measure the volatility of currency pairs. A high ATR indicates greater price volatility, which may require wider stop-loss levels; conversely, a low ATR reflects more stable price action.
Adjust risk management
- ATR for setting a stop-loss level: Traders can use ATR to set stop-loss levels appropriate for the volatility of the foreign exchange market. Setting a wider stop-loss during periods of high volatility helps avoid being stopped out by small fluctuations. While a tight stop-loss is more effective when the market is less volatile.
- Position sizing: Forex volatility indicators help determine position size based on foreign exchange market conditions. In a low-volatility environment, traders can open larger positions, while in a high-volatility scenario, smaller positions should be prioritized.
Spot trend reversals or breakouts
- Bollinger Bands: When the price touches the upper or lower band and then starts to move back toward the center, this information can signal a potential reversal. Conversely, a price breakout outside the bands often indicates a strong trend is continuing or a new trend is forming.
- VIX (Volatility Index): A high VIX indicates market fear. Typically, this is a sign of an upcoming reversal or strong volatility. Accordingly, a low VIX indicates investor complacency. However, traders also need to be cautious as this could be a precursor to unexpected strong fluctuations.
Top 5 best forex volatility indicators
Below are the top 5 best forex volatility indicators that widely used by traders to assess market fluctuations and manage risk:
Bollinger Bands
The Bollinger Bands are composed of three bands: the upper band, the lower band, and the middle band.
In which, the middle band is the 20-day moving average or 20 candlesticks, the upper band is the standard deviation of +2, and the lower band is the standard deviation of -2 of the middle band.
Meaning of Bollinger Bands in the market: As market volatility increases, these bands will widen, and as volatility decreases, they will narrow.
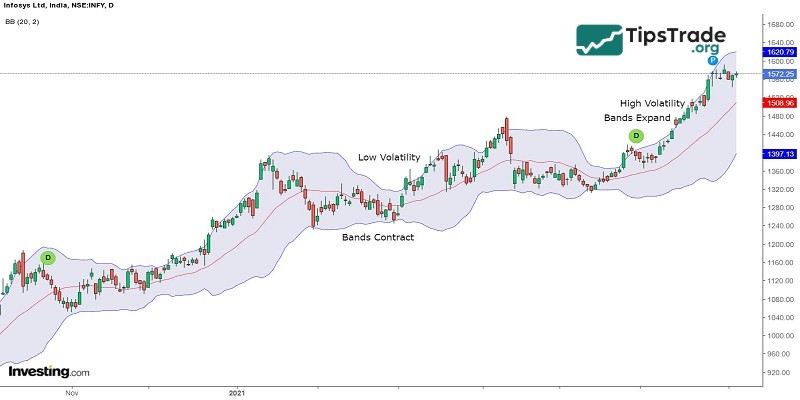
Investors can trade based on Bollinger Bands when the price breaks out of either side of the upper or lower band after a period of low volatility or consolidation.
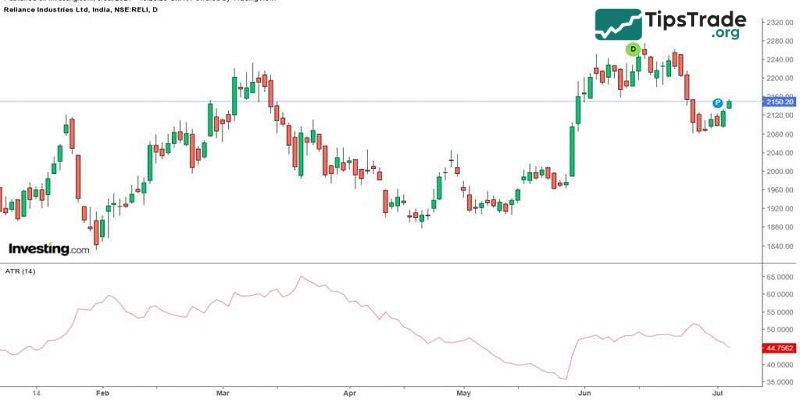
Average True Range (ATR)
The Average True Range (ATR) indicator measures the actual range of price fluctuations over a certain number of price bars, usually 14 bars.
ATR is a pure measure of price volatility and does not necessarily reflect a trend. Occasionally, sharp price swings can occur in a volatile market when significant news events are taking place.
The best way to use ATR is to use it as an indicator of a change in the nature of the market.
Accordingly, when the ATR index increases, it indicates a wider trading range and therefore increases volatility. In the opposite case, a low ATR suggests periods of quiet or low trading activity.
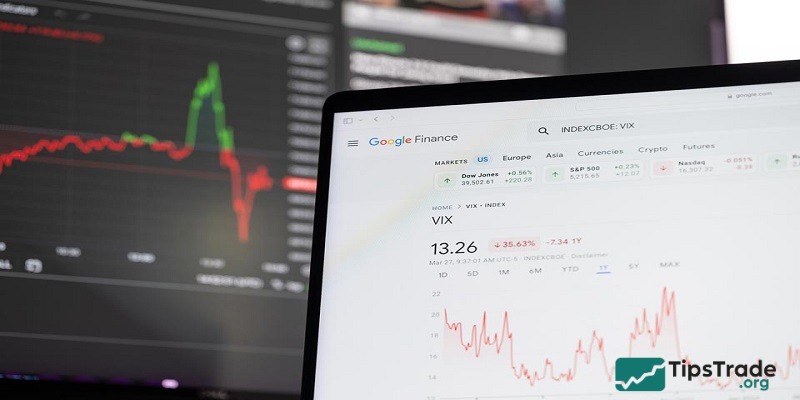
Volatility Index (VIX)
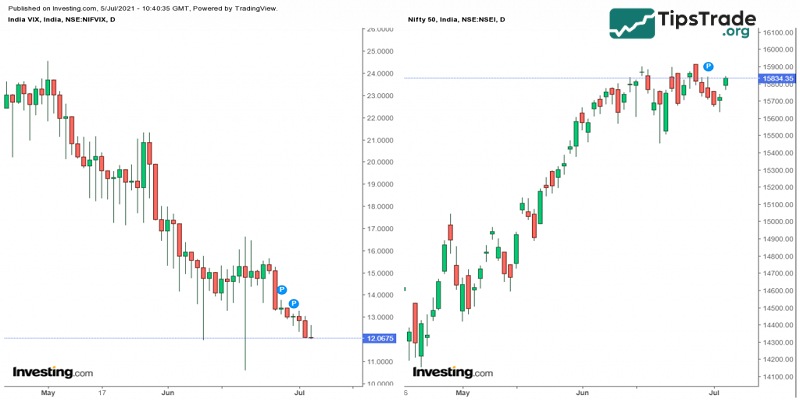
The Volatility Index (VIX) is an indicator used to measure expectations about short-term market volatility.
India’s volatility index is called India Vix, launched by the National Stock Exchange (NSE) in 2008.
The India Vix index reflects the volatility of the Indian market as perceived by investors.
When the India Vix index is high, it reflects expectations of greater volatility, meaning the Nifty index will experience significant changes. Conversely, a low India Vix value indicates expectations of lower volatility, meaning the Nifty index will experience minimal changes.
The India Vix index has an inverse relationship with the Nifty index. When the India Vix decreases, the Nifty increases, and when the India Vix increases, the Nifty decreases.
Keltner Channel
Keltner Channels is a volatility-based indicator that is placed on either side of the currency pair’s price and helps in determining the direction of a trend.
The Keltner channel uses the average-true range (ATR) with breaks above or below the top and bottom barriers that signals a continuation in the trend.
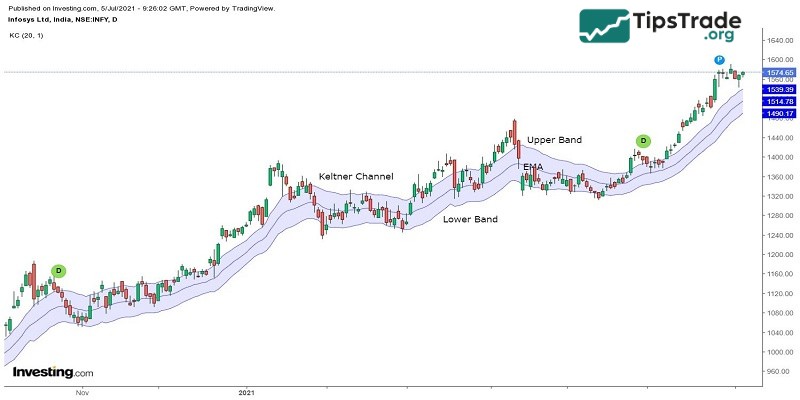
The middle line is an exponential moving average (EMA) of the price. The upper band is usually set two times the ATR above the EMA, and the lower band is set two times the ATR below the EMA.
These bands generally expand and contract as volatility which is measured by ATR expands and contracts.
Donchian Channels
Donchian Channels is one of the popular forex volatility indicators determining volatility in the market prices.
This indicator is created by three lines that are generated by moving average calculations.
It consists of three bands: upper and lower bands around a median band.
The upper band shows the highest price of security whereas the lower band shows the lowest price of a security over a specific period, usually 4 weeks.
The area between the upper and lower bands is the Donchian Channel.
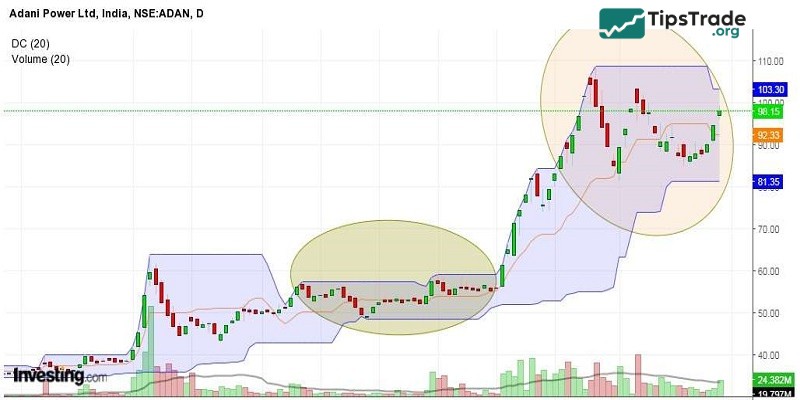
Investors can enter a buy trade when the prices break from the upper band and they can enter a short position when the prices break from the lower band.
How to identify the fastest forex volatility indicators
For forex traders who want to respond quickly to market movements, identifying the fastest volatility indicators is crucial. Below is how to identify and use fast forex volatility indicators effectively:
Bollinger Bands: Quickly respond to price changes using the EMA.
- Formula:
- Middle band = EMA(n)
- Upper band = EMA(n) + (k × Standard Deviation)
- Lower band = EMA(n) – (k × Standard Deviation) (n: number of periods, k: constant, typically 2)
Average True Range (ATR): Using shorter time frames (7 or 10 periods) allows faster reflection of price movements.
- Formula:
- ATR = [(Previous ATR × (n-1)) + TR] / n
- (TR: True Range, n: number of periods)
Donchian Channels: Responds to the highest high and lowest low within a set period.
- Formula:
- Upper band = Highest price over n periods
- Lower band = Lowest price over n periods
Forex volatility indicators vs. Trend indicators: What’s the difference?
The comparison table below will help you understand the differences between Forex volatility indicators vs. Trend indicators:
|
Criteria |
Forex volatility indicators |
Trend Indicators |
|
Purpose |
Measure the magnitude of price fluctuations or market instability |
Identify the direction and strength of a market trend |
|
Common Examples |
Bollinger Bands, Average True Range (ATR), Standard Deviation |
Moving Averages (MA), MACD, Relative Strength Index (RSI) |
|
Focus |
Price volatility and risk |
Trend direction (uptrend, downtrend, sideways) |
|
Reaction to Market |
More sensitive to sudden market changes |
Focus on long-term market direction, less responsive to short-term noise |
|
Usage in Trading |
Used to identify market volatility, set stop-loss, or breakout potential |
Used to enter and exit trades based on trend strength |
|
Strength |
Good for identifying high-risk/high-reward situations |
Best for following market trends, avoiding false signals |
|
Limitations |
Can give false signals in low volatility periods |
Lags in fast-moving markets, especially in consolidating phases |
|
Calculation Basis |
Price range, standard deviation, or price movement over time |
Price averages over a set number of periods |
|
Time Sensitivity |
Often short-term focused |
Can be used for both short and long-term trends |
|
Example Formula |
ATR = [(Previous ATR × (n-1)) + True Range] / n |
MA = Σ Price over n periods / n |
Conclusion
The above is all the knowledge about Top 5 best forex volatility indicators that every technical trader should learn. Wishing all forex traders good luck and success in their trading! Thank you for taking the time to read this article.